
This post started three years ago as a place to collect campaigns worth borrowing from. It’s become our go-to for collecting the best digital PR examples to fuel brainstorming sessions. (For the full playbook, here’s our digital PR strategy.)
What’s changed in three years isn’t the frameworks. A city study works the way it worked in 2022. What’s different is that earned media now accounts for 84% of what AI models cite when they answer a question (May 2026, Muckrack). The pitch that lands a story in a local paper also influences whether your brand shows up in an AI answer about your category.
While we know there are hundreds of well-executed campaigns, in this collection, we’ve narrowed it down to a select few that generated valuable brand mentions and media buzz while also meeting a few key criteria.
We’ve organized the best digital PR examples by winning frameworks we’ve seen consistently perform:
- City & Geographic Studies → One dataset, fifty local angles. The most reliable way to get picked up by local news desks at scale.
- Maps → National reach and local pickup at the same time, if the design is clean and data visual informative.
- Surveys → For when the story is about what people think or do and nobody has measured it.
- Dream Jobs → No data required. Buys attention fast and travels on social. Short shelf life.
- Studies & Analysis → Proprietary or public data, analyzed properly. The most citable format on this list and the one with the longest tail in AI answers.
- Interactive Examples → Calculators, tools, and games that keep earning links years after launch.
- Visual Experiments → For categories with no natural data story. High risk, high ceiling, and only works when the concept ties tightly to the brand.
- Seasonal & Holiday → A predictable calendar you can plan around. Refresh the winners annually on the same URL.
Skip ahead to the five campaigns published this summer, which is the section we update most often (July 2026).
What is a Digital PR Campaign?
A digital PR campaign is a planned marketing initiative that uses research, storytelling, content assets, and media outreach to earn coverage, brand mentions, backlinks, and visibility across digital channels. A strong digital PR strategy connects the campaign idea to a broader business goal. That might mean earning high-authority links that support search engine rankings, generating media mentions that improve brand awareness, or creating a useful resource that continues attracting organic traffic long after outreach ends.
Digital PR is used differently across industries. Some companies use it primarily to earn SEO backlinks, while others use it to build brand authority, earn media coverage, or increase visibility in AI-generated answers.
What the Best Digital PR Campaigns Have in Common
The best digital PR campaigns do more than produce a newsworthy headline. They give journalists a clear story, make the findings easy to verify, and provide an asset worth referencing, whether that is a map, dataset, infographic, interactive tool, or expert analysis.
Every campaign in this post clears at least two of the seven criteria below. Most clear four. It is the same list we use to evaluate whether an idea can earn coverage, build brand authority, and remain useful after the initial media outreach ends.
- Authoritative. The brand has a real reason to be the one talking about the topic.
- 2+ topics. The idea combines two or more diverging topics: BBQ + July 4th; Podcasts + TV.
- Timely. A season, holiday, or live news cycle to attach to.
- Verifiable data. Proprietary, recognized dataset (ex: Census), or a survey. The source is named, and the method is stated plainly enough that a skeptical editor can trust the analysis.
- Resourceful, useful. A visual, chart, map, calculator, or tool a newsroom can drop into a story.
- Starstruck. A name or brand people already know is in the mix, like “Wes Anderson” or “Spotify.”
- Unexpected formats and delivery. Ask people to draw logos, 52 weeks of perfect weather, or a calculator that tells you how many Americans actually meet your dating standards.
Case study · Digital PR
15 days
from study launch to The New York Times
A 100-city index and an interactive map became a Times Calculator column.
The Best Digital PR Examples Right Now (Updated July 2026)
These are some of the strongest digital PR campaigns we’ve seen earning coverage recently. We’ll continue refreshing this section with new examples.
Where Summer Drives Up Burglary (and Where It Doesn’t)
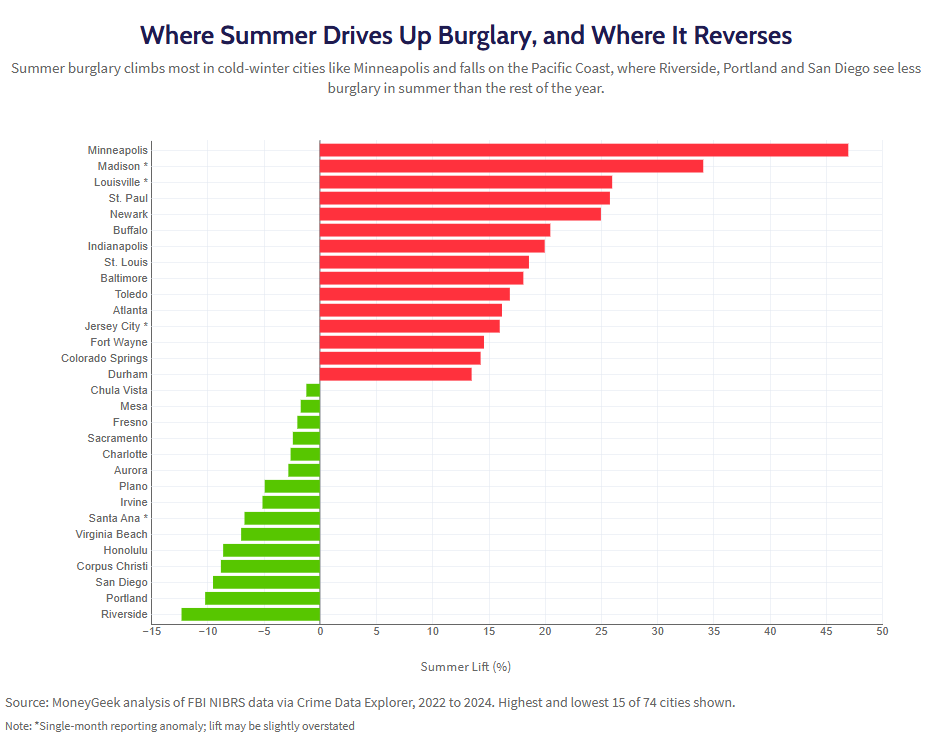
Home security and insurance blogs often discuss how burglary rises in summer. So, MoneyGeek dug into three years of FBI NIBRS data for the 74 largest reporting cities, ultimately finding that the overall rise is just 5.6%.
Two things to steal. The regional structure hands every local outlet its own angle. They published a finding that complicates the seasonal security messaging their own insurance category runs on — while clearly spotlighting the states where that claim holds true.
Travel Scams Are Surging: The States Hit Hardest by Vacation Fraud
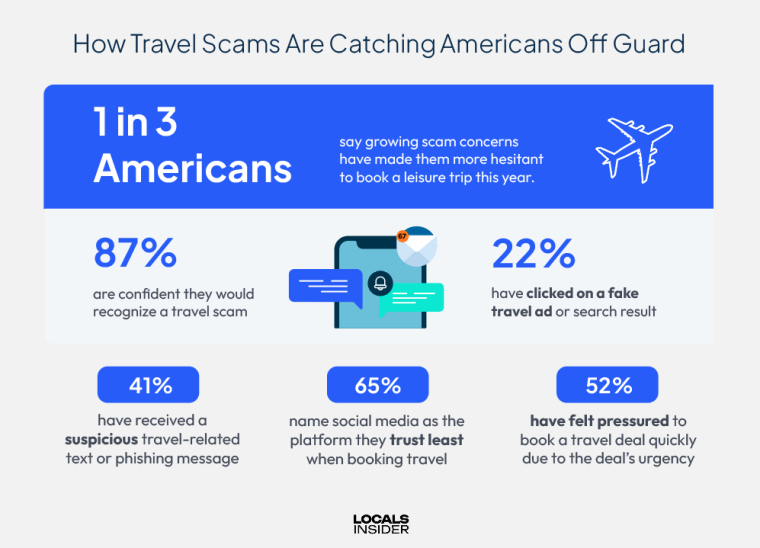
Two datasets doing two jobs. FTC fraud data produces a state ranking, which is what gives local reporters something to write. Plus, a survey of 1,005 Americans produces the national headlines: travel fraud losses have nearly tripled since 2021, and 87% say they’d confidently spot a scam while 22% admit clicking a fake travel ad.
The survey is what helps this campaign stand out. Pairing it with the fraud data provides reporters with behavioral insights on what travelers are doing in response to the increase in fraud, that helps tell the full story.
Where the Down Payment Burden Has Grown Most
SmartAsset compared home values in 2016 and 2026 against median income in all 50 states to estimate how long saving a 20% down payment now takes. Idaho changed most, at 11.2 years, up three years and four months.
The ranking isn’t the only story here. Two other things are. First, in three states the math got better, with Louisiana improving by seventeen months, which hands Louisiana outlets a national report their state wins. Second, they ran the same math at minimum wage. In Missouri, the best state for this, a minimum-wage worker would need 17 years to save a down payment. In Utah, more than 70.
The Most Talked-About TV Shows on Podcasts in 2026
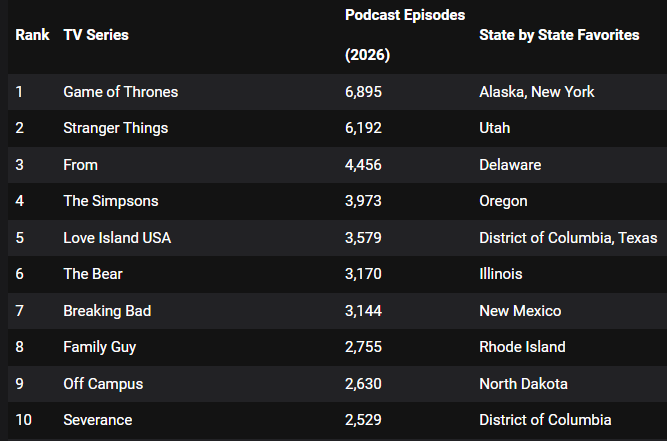
BetMGM bet on the basics: A straightforward analysis of 73,375 U.S. podcast episodes published this year (January and July 2026) crosschecked by IMDb’s 50 most popular TV series. Game of Thrones won the most mentions seven years after it ended, beating Stranger Things, Severance, and its own prequel. Parade and NewsNation both covered the findings.
What we like most is where the data came from. Podcast transcripts are public, there are a staggering number of them, and almost nobody in our field is touching them. It’s worth asking what people are saying about your category on podcasts, because odds are nobody has checked.
Best & Worst States for Summer Road Trips
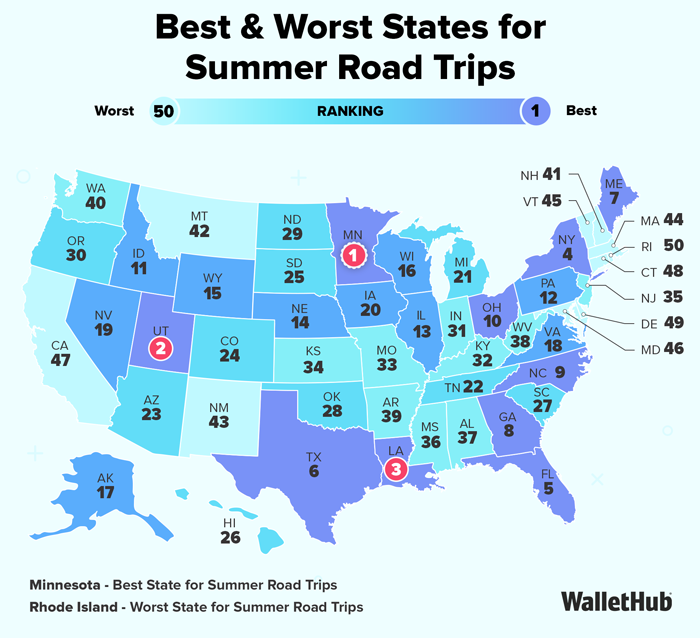
WalletHub scored all 50 states on 32 metrics across cost, safety, and activities. Minnesota took first. California landed 47th, and that entry shows exactly why these work locally: first for activities, second for scenic views, then dead last for cost. Every state gets its own version of that tension, and every local desk gets a story.
This is a perfect example of how to refresh annually on the same URL, something they do with an unrivaled cadence. Citations from every previous edition compound on one address instead of scattering across new posts. That’s the reason their studies dominate.
Coverage this year included NBC Bay Area, Kiplinger, Mental Floss, and the Nexstar wire.
5 Digital PR Ideas for Summer 2026
Every month we spend time brainstorming. What’s being covered? What topics are hot? And what questions can our clients answer with data that can help reporters tell a story that matters?
- Summer cost stories. Cooling bills. Campsite fees. Road trip costs.
- Summer destination ranking. Every state’s top swimming hole or favorite international travel destination.
- Seasonal proprietary data. Booking patterns, searches, etc. Filter it to June through August, or compare summer to the rest of the year.
- Trend analysis. A few on our radar: “-maxxing” trends, Cyclospora outbreaks tied to summer produce, AI adoption, and GLP-1s.
- Myth testing. Test a seasonal claim your category repeats every summer against real data. It holds or it doesn’t, and either way it’s a story.
City & Geographic Studies: Optimal for landing local coverage
City study campaigns are a tried-and-true, well-tested format for creating campaigns that get both national and local coverage. They can be paired with a wide range of topics – from very serious ones to very silly ones. They align perfectly if the company commissioning the campaign has a business tied to places and geography. Real estate, personal finance, and travel companies are a great fit for these. Local news stations love to cover these because they are a chance to discuss what their city excels (or fails) at. Here are some standout examples (36 more geo-ranking examples can be found in our dedicated post here).
1. Will These Be the Most Populated U.S. Cities in 2100?
moveBuddha (created by Green Flag Digital)
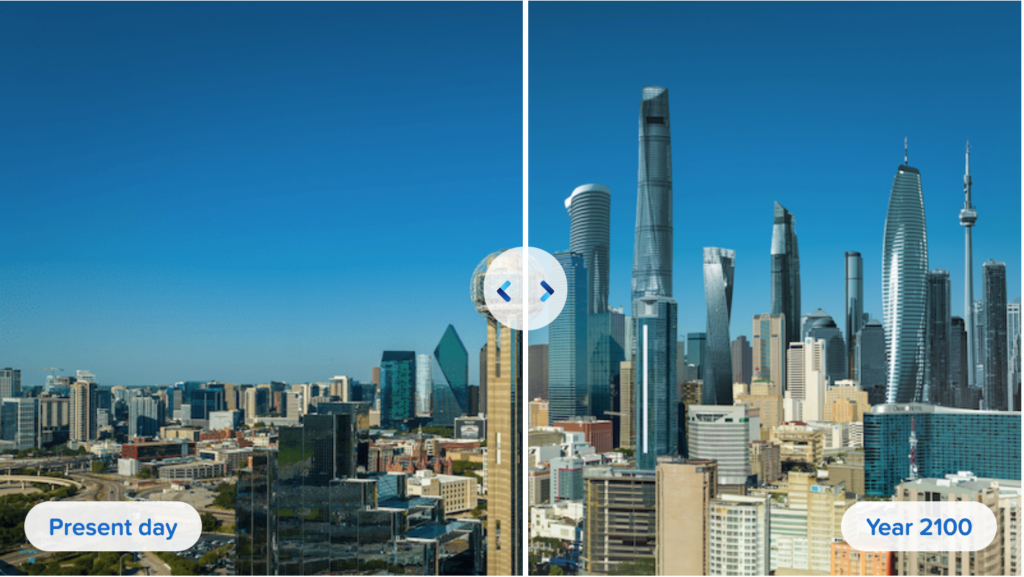
What will the largest cities be in 2100? Will they look anything like today? We worked with moveBuddha to answer this question, and the results were shocking: Dallas is predicted to be the largest city in 2100 with over 30 million people. This lines up with the aggressive approach by Texas leaders to court California businesses and the cowboy approach to letting everyone build, build, build without restraint. This campaign was a combination of data and conceptual visuals. The results: top-tier placements on the likes of Houston Chronicle, NBC Austin, ABC Dallas, and many more. What’s more, it is currently the #3 ranking for “cities in 2100“.
How we did it: Get this – we set out to generate these future images with Midjourney, but it was impossible. Midjourney is great for more generalized conceptions, but it couldn’t work with the exact futuristic details we were looking for, and it couldn’t align things with our starting photos. So we found an awesome conceptual photo manipulation artist to help us bring these to life. Painstakingly slow, but the results were amazing.
2. The States and Cities That Pay the Most and Least for Takeout
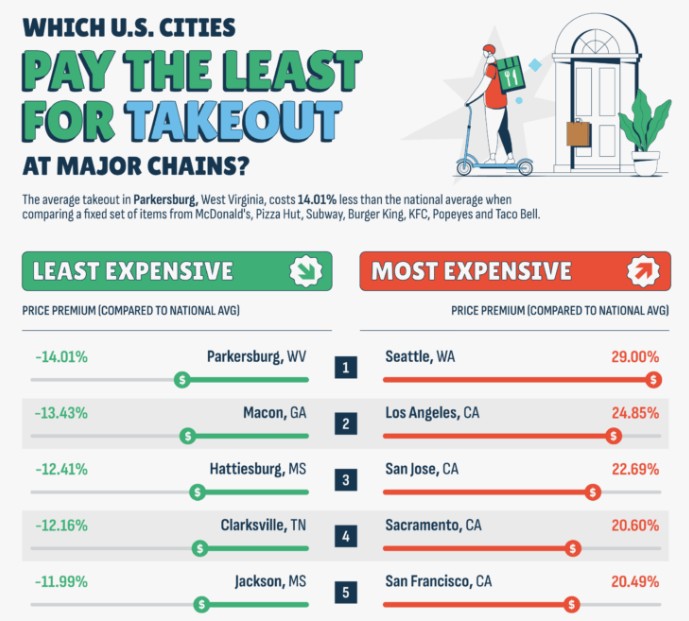
This study taps into three things media loves to talk about: local trends, affordability, and food. A clearly defined methodology explains exactly how the study measures late-night munchies and overall fast-food habits across U.S. cities. Editors ate it up, with coverage stretching across the Atlantic in the Daily Mail as well as features in Food & Wine and Men’s Journal.
3. Best BBQ Cities in America
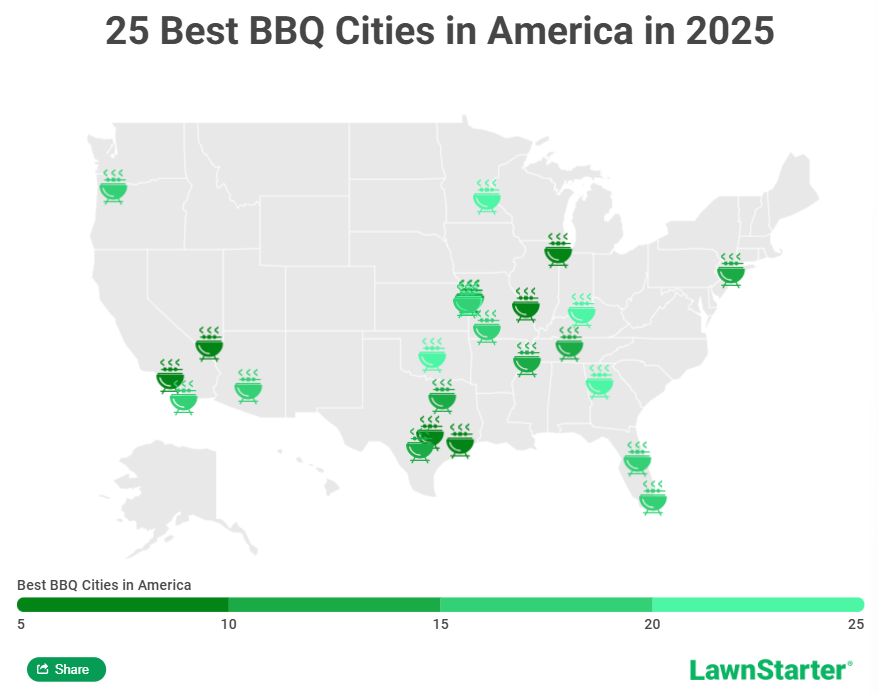
From the most well-known holidays to the more obscure (World Naked Gardening Day, anyone?), we know we can rely on the Lawnstarter team for cooking up clever and timely holiday-themed campaigns that score major coverage. For instance, this BBQ-themed piece was released right in time for July 4th. Coverage ranged from local news to iconic foodie sites like Eat This, Not That! to dad-focused Fatherly.com.
4. Safest and Most Affordable Cities in the US
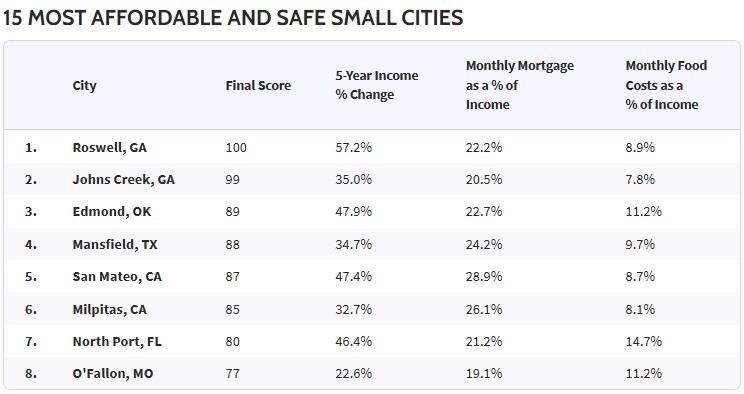
Personal finance site MoneyGeek breaks down which counties in America are most unaffordable for locals in this campaign. “Unaffordable” is a key player in this campaign and helps the analysis stand out in a sea of stories related to mortgage, finance, housing, etc.
5. Happiest Cities in America

The Wallethub content team creates the most AEO-proof campaigns we’ve ever seen: original, deep data studies analyzing cities and states, annual updates to keep the data fresh, clean tables, FAQs full of unique insights from expert voices, and it’s no secret that when we need source inspo, we definitely go see where they are pulling their data from. We particularly love their report on the happiest cities in America in 2025. I’m sure every journalist knows the name Wallethub, because their studies dominate media stories about the best cities all over the map and across a wide range of topics. This one scored features in LiveNOW from FOX and Travel & Leisure.
Maps: Pretty and effective, pretty effective
These visual campaigns are especially popular in the travel sector, but we’ve seen them successfully used for a wide range of topics, including finance, food/drink, popular culture, marketing, and more. The key is in the design. Keep it simple and to the point, and make sure that the data is easy to read. The strongest maps function as both editorial visuals and standalone infographics.
A reporter should be able to understand the central finding within seconds, pull out the result for their location, and embed or reference the visual without needing to reconstruct the analysis. When drawn up just right, these map campaigns have the potential to be featured on national outlets or very targeted industry outlets.
6. Around the world in perfect weather: A 52-week dream trip
Reservations (created by Green Flag Digital)
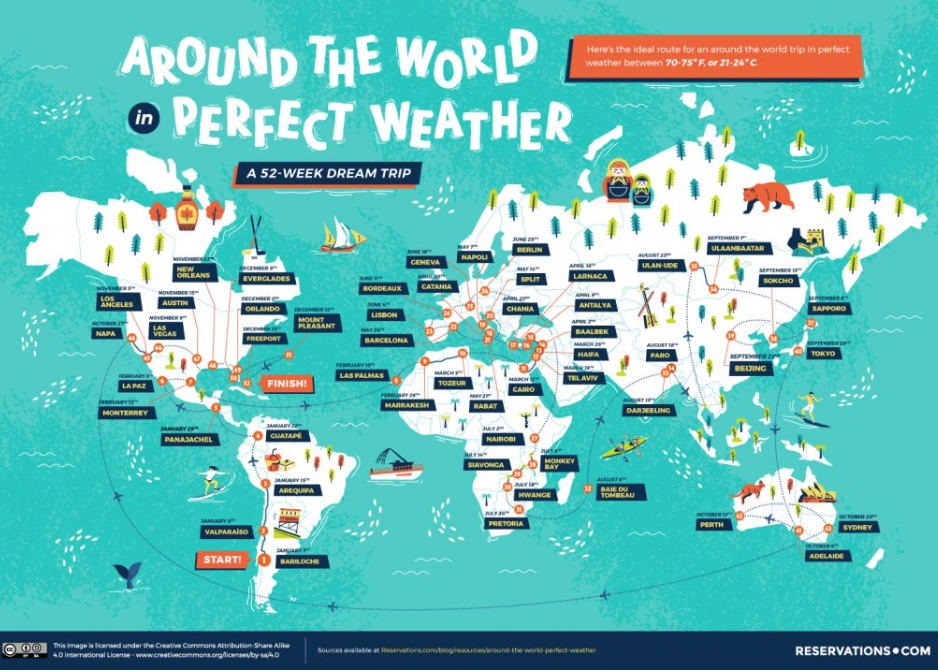
This map provides the perfect weather itinerary for anyone looking to spend a year traversing the globe. Stunning visuals and a budget breakdown meant travel sites like Lonely Planet and Matador Network were eager to share the findings, and even MarketWatch gave a shout.
How we did it: Our team combed through reams of weather data from Accuweather and crunched the numbers based on time of year, location, proximity to previous and next location, and a few other factors. Sure, you could figure this out with AI, ML, and APIs, but we did it the old-fashioned way. This was a doozy and is one of our most premium campaigns ever created, as well as one of our most successful.
7. Alternative Relocation Destinations

From Vancouver and Barcelona to Miami, where people want to go, makes destination-city locals proud. Naturally, they want to share the hype about why their city may be the best. Coverage landed especially in local outlets like NBC Miami and sites that cover travel and lifestyle trends like Mental Floss.
8. What are the most translated books in the world?
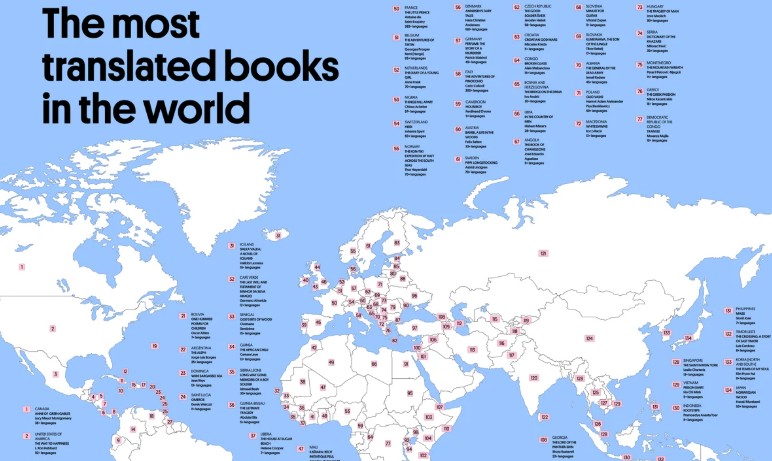
Preply is regularly churning out studies on words, language, and culture, from quantifying America’s subtitle obsession (which I didn’t know we had, but I definitely do) to examinations like this one, of the most translated books in the world. The map is simple, the stretch is global, and it was shared across the globe, including IRNA (Iran), Femina (France), and Wikipedia, too.
9. The most Googled artist in every country in the world
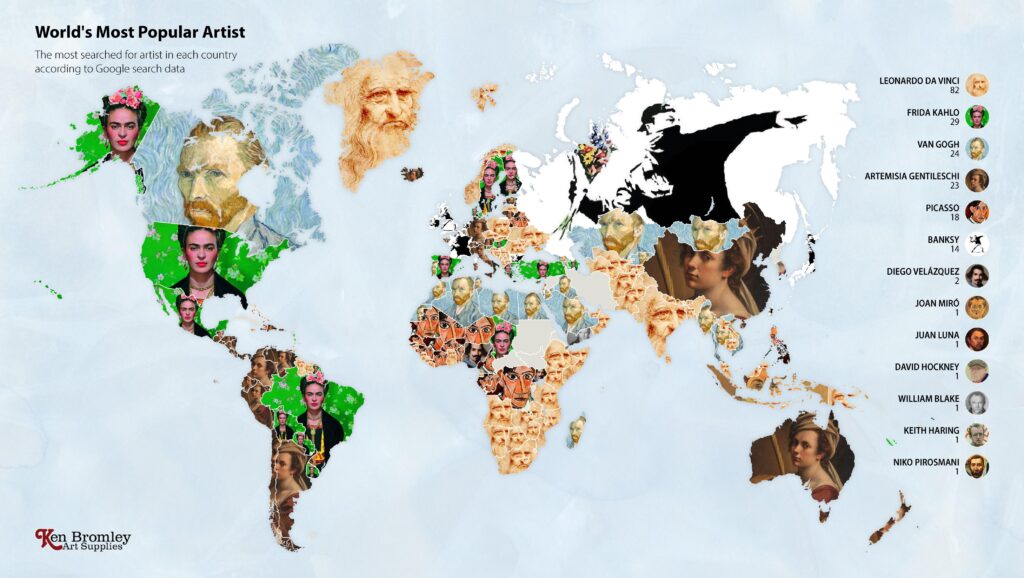
This no-frills map of the most Googled artist in every country was especially a hit with art-centric outlets like CreativeBloq, designboom, and DesignTaxi.
10. Hotspots for Truck Stops and Rest Stops

Truck stops aren’t just for truckers. altLINE’s study turns the routine pit stop into a media-friendly data story. They examined nearly 100k Google Maps reviews and clearly showcased the findings in a series of detailed maps. Coverage landed in hyper-relevant industry sites like The Trucker and Fleet Owner, as well as several radio placements, bringing the findings directly to those who care most.
Surveys: Targeted insights that resonate with wide audiences
Polling samples of a population to glean insights is a powerful link-building tool. Whether you have the ability to poll a sample set of your own site users or employ a survey tool (like Pollfish), the important thing is to shine a light on a specific topic or issue. Responses can also often be sorted by demographic factors (like age and gender) to provide more granular detail and reveal a more interesting story.
11. 1 in 3 Americans Say Messiness Makes Their Partner Less Attractive
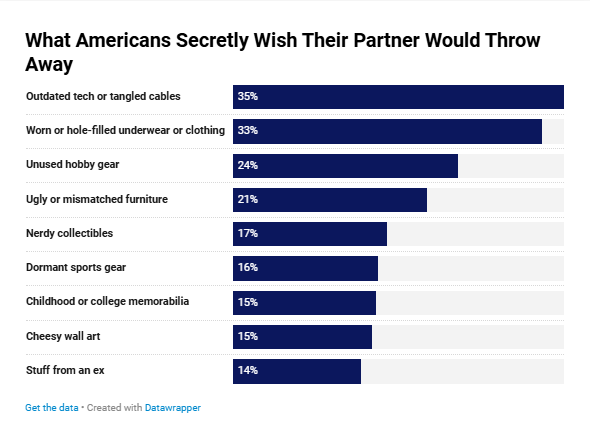
Surveys rooted in emotional, everyday experiences are primed to grab media attention, and this one from The Storage Center does just that. The post is straight to the point and shares simple data visuals of the survey findings. Coverage in GQ and Vice shows how emotionally charged, highly relatable data can make home storage topics relevant to mainstream lifestyle and culture outlets.
12. Houzz & Home Study: Renovation Trends
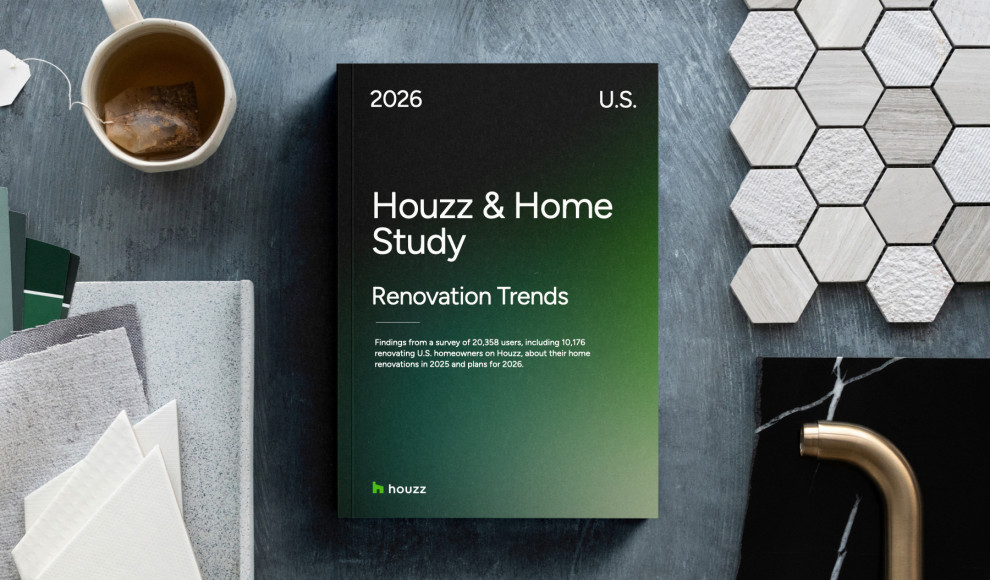
Surveying a massive 46k+ users, the extensive results of this Houzz survey resulted in multiple pieces of content exploring home renovation trends today. Houzz aggregates home service providers for everyday consumers and also offers management software tools for construction and other trades – they practically own the market. The New York Times, Apartment Therapy, and Pure Wow are just a shortlist of the many national outlets that covered the annual report and do so year after year.
13. Triggered: What is Zoom Anxiety, and what can we do about it?
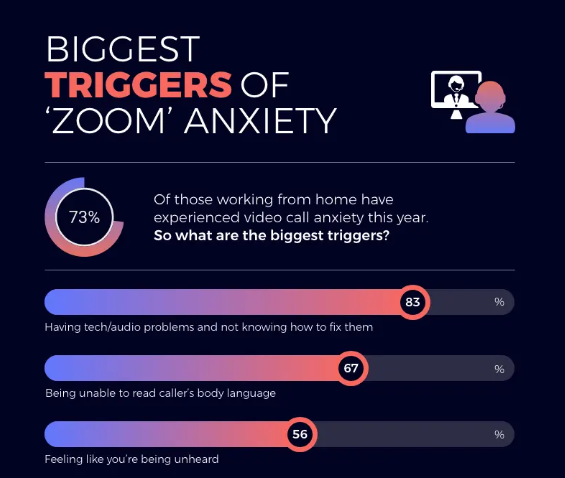
Back in 2020, the use of Zoom and anxiety levels were both running high. This survey taps into the emotional cross-section of the two in a very simple survey. TechRadar, Thrive Global, and Healthline all cited the findings.
14. Voices of Gen Z Study – Walton Family Foundation

The Walton Family Foundation and Gallup have surveyed members of Gen Z about their lives, education, and aspirations. They did a 2025 study (which they release annually) that reveals a complex picture of Gen Z’s wellbeing and preparedness for the future. Their methodology involves a web survey that was conducted May 16-27, 2025, with a sample of 3,793 13- to 28-year-olds living across America. One key stat that stood out to me is that Gen Z has fallen to its lowest level in life evaluation, as just 45% are considered to be thriving. PR Week, Observer, and Business Insider are just a few that covered them.
Dream Job Campaigns: Old trick, new links
Some find this old campaign format tired and overused; others realize that it’s simply one that just works. When done just right, employing the dream job format is a fun way to engage potential customers (and they may earn some cash along the way), plus, it’s a great way to splash your brand name across major media, get socials talking, and (ever important) earn valuable links.
15. Hidden Valley Ranch-bassador Program
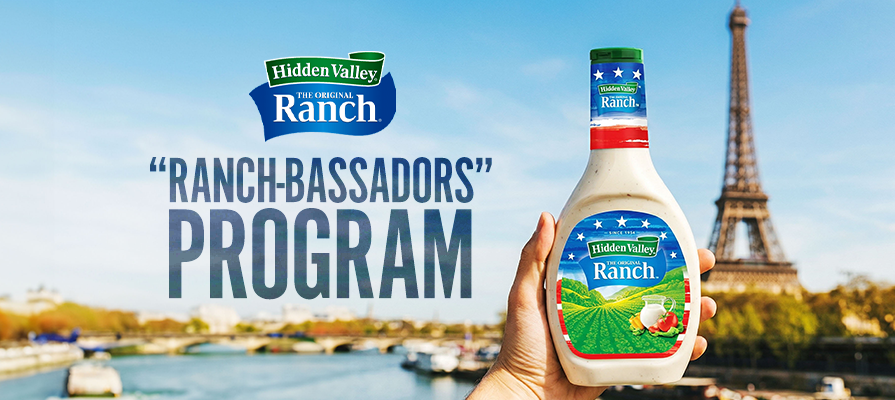
This dream job hired four lucky winners to “quest across Europe” for seven weeks and spread the love of ranch abroad. The opportunity not only covered all travel and expenses, but also included compensation for 40 hours a week. Coverage dominated foodie outlets like Food Network, Tasting Table, Sproked and Delish as well as major publications like The Independent, NewsNation, and USA Today.
16. FOX One Chief World Cup Watcher
$50K to watch all 104 matches across the 39-day FIFA World Cup™ tournament? This dream job pays to be a sports fanatic. The campaign ran wild because, well, sports and the World Cup. Local coverage, national coverage, sports-specific coverage, and more culminated in over 100 DR 50+ linkages.
17. Boardwalk is looking for a Social Media Content Creator
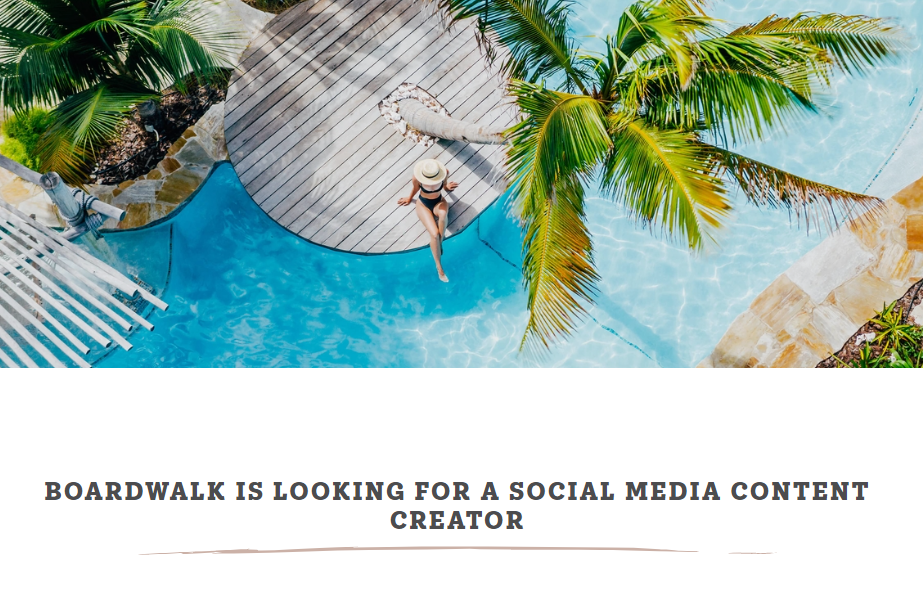
One month, all expenses paid, stay at the boutique hotel Boardwalk Aruba for a qualified Social Media Content Creator is the job. In other words, it’s an all-expenses-paid vacation to take selfies and sunbathe. Coverage for the brand landed at Time Out and Narcity and international travel sites like Viaggi News and Travelo.hu.
18. OLIPOP Senior Soda Consultants

In 2024, OLIPOP hired two “Senior Soda Consultants” — part of their “Real Love Makes Us” campaign, which aimed to generate buzz and promote their brand’s healthier alternative soda. The jobs of the Senior Soda Consultants involved traveling to different cities across the U.S., sharing their enthusiasm for OLIPOP, and creating content for them to use across their socials. The chosen consultants received $10,000 per city they visited (up to four cities), covering their travel and hotel expenses…getting paid to travel and drink free soda?! Sign me up. Their campaign was successful, contributing to high sales figures (OLIPOP jumped in revenue from $75 million to $200 million) and strong community engagement. They earned coverage from outlets like the New York Post and Travel + Leisure.
Studies & Analysis: Turning data into shareable stories
With the internet and technology, the ability to get our hands on large public datasets, scrape websites for specific details, or even conduct a social study is more feasible than ever. This is a gold mine of opportunity for digital PR folks. There are thousands of opportunities to pull together data and uncover really unique insights about, well, almost anything.
19. Driven to Distraction: What are the most distracting driving songs?
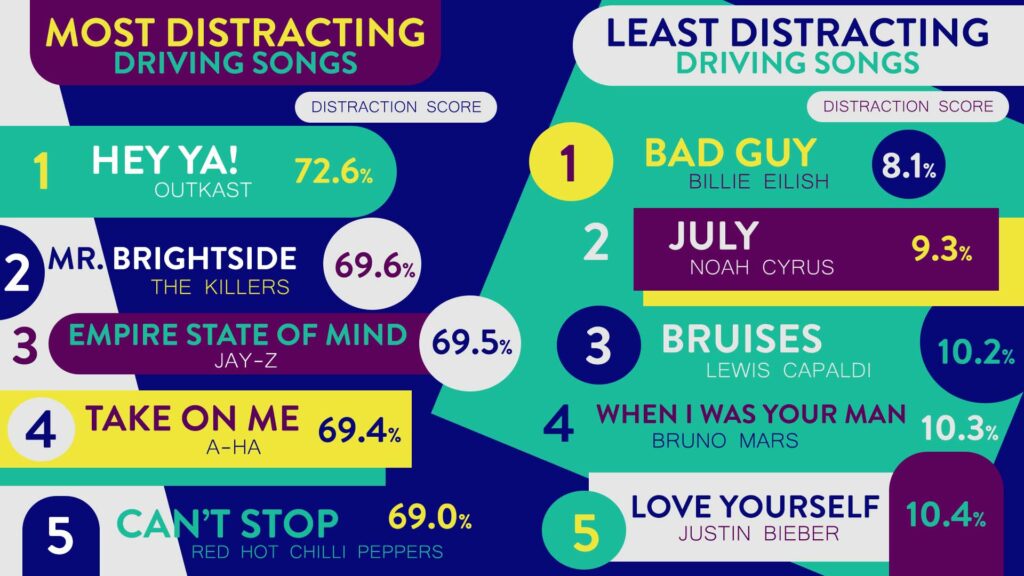
Radio stations loved sharing the news about the most and least distracting driving songs. From iHeart Radio to PlayerFM, the coverage for this campaign was probably distracting drivers tuning in. Simply diving into Spotify playlists, devising a score for “distractability,” and publishing the findings culminated in a winning campaign. Bonus: There’s a playlist too.
20. Branded in Memory
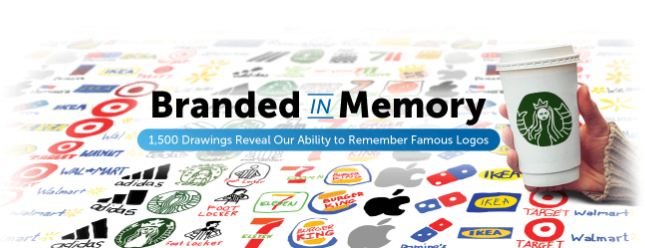
Can you remember how to draw the Starbucks logo? What about Apple? (Should be easier, right?) This compelling campaign dives deep into how deeply brands leave an imprint. Coverage was prolific, from niche-specific coverage to lifestyle news, and both national and global news covered the findings.
21. The Most Popular Thanksgiving Side in Every State
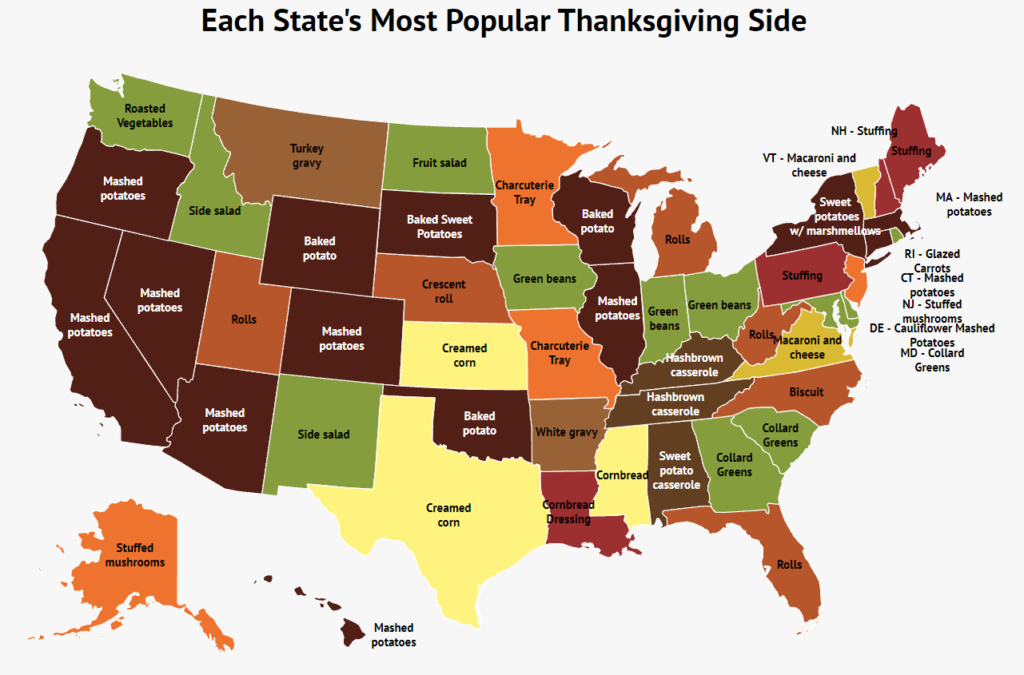
Zippia hits up Google Trends data at the timeliest moments to score major coverage with fun, even funny, and lighthearted topics. This Thanksgiving-inspired campaign made headlines on major sites like Thrillist and The Takeout too.
22. Spotify Wrapped Map

In 2020, over 90 million people engaged with Spotify Wrapped. That helped support a 21% increase in Spotify app downloads during the first week of December. Every year Spotify does a little more, and now creates a yearly “Spotify Wrapped Map” that displays their data showing the top songs people listen to across the world. You can zoom in on the map and click on different areas to see the top songs people are listening to in those places. This example bleeds into the interactive examples (below).
Interactives: Games, calculators, and everything in(teractive) between
Want to really engage your audience? With more digitally savvy consumers, creating a clickable, customizable, maybe gamified, and interactive campaign is much more fun than the standard static. Make it a truly useful or insightful tool, and expect the links to pour in.
The format alone is not enough. The best interactives answer a real question, generate a result people want to share, and connect naturally to the company behind them.
23. How Old are Your Reactions? [Game]
From parking app Just Park, this interactive short game tests your reaction times and provides an age that correlates. Coverage was extensive, from IFL Science to CarProUSA and various sites in over 20 other languages.
24. Your summer trip calculator [Calculator]
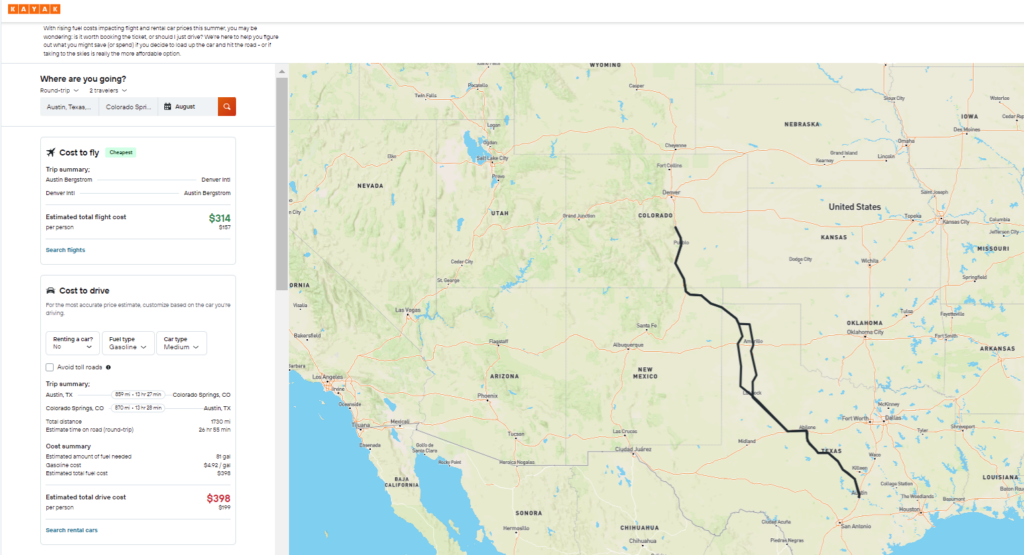
Rising fuel costs are making travel more complicated, so travel site Kayak decided to help. This calculator makes it easy to see whether flying or driving is the more affordable option. The Daily Hive, Travel Off Path and Toronto-based BlogTO have all shared the news about this handy tool.
25. What Percent of People Meet Your Standards in the U.S.?

A dating app called Keeper, founded in May 2022, created an interactive calculator — users answer 14 simple questions about their dating standards, to see the actual percentage and number of men or women in the United States who actually meet those standards. The results prompt you to “find them on keeper” after they deliver your results. Keeper describes itself as an AI-driven matchmaking solution that works better than traditional swiping apps, as they only facilitate connections where each person meets all of each other’s stated criteria for a long-term partner. The calculator gained lots of traction on TikTok in 2024, as people posted their results and it became a viral ‘standards test’.
Visual Experiments: Risky business, worth the risk
We needed a place to collect some really fun campaigns that didn’t exactly fit the typical framework.
One thing all of these campaigns have in common: a super shareable out-of-the-box and even unexpected visual component. The key to making this type of risk-taking visual campaign work is by aligning the topic very close to the brand to tap into that authoritative power.
26. If Wes Anderson Designed the Interiors of The Simpsons

Super stylized cinematic vibes meet some of the most familiar TV “sets from The Simpsons. This artsy-fartsy campaign is just so extra. Naturally, it was also a huge hit with art, architecture, and design-focused outlets.
27. Coca-Cola Year 3000 Generative AI Campaign
Coca‑Cola® Creations Imagines Year 3000

Hey, Coca-Cola wants to do generative AI too! Not surprisingly, what I’ve found in the world of marketing is that the oldest and “simplest” product brands like drinks, food, soap, and insurance, often do the most creative campaigns. They’re going after pretty much every consumer that exists, in different segments, and want to keep top of mind and relevant.
In this experience, you scan the QR code on your phone, take a picture of something and the app will imagine that image in the future. Have to say it’s a pretty good experience in that you can take a photo right away and generate a new one. The results are decent – wouldn’t say as good as the best of Midjourney – but pretty good for their execution.
28. Nike’s Foot Scanning Tool
Returns are a drag, especially when a half-size miss means a trip to the post office. Nike tackled that pain point with Nike Fit, an AI-powered foot-scanning tool in its app. Using your smartphone camera, it builds a 3D model of your feet and recommends the right Nike size. Launched in 2019, it was an early, practical use of computer vision in retail, and it set a template others now follow. Amazon, for example, lets shoppers use their camera to gauge an item’s true scale in their space, turning guesswork into confidence before they buy. They got great coverage on this, including a publication on Forbes.
Seasonal & Holiday Campaigns: Halloween, Christmas, New Years and More
People love holiday and seasonal campaigns. Therefore, journalists love these campaigns as they seek to quench the undying thirst for more entertainment from social-media-spoiled citizens at an ever-increasing rate.
These campaigns can be a bit hit or miss. You want to execute on the creative far enough in advance for approvals, and be able to launch at just the right moment, while hoping not to be swooped by competitors or your friendly journalist friends. My advice: evergreen campaigns that involve multiple holiday or seasonal elements throughout the year that you can rotate are great. You can also refresh successful campaigns on an annual basis and do well a bit more every time.
29. Instacart’s Cornucopia of Thanksgiving and Winter Holiday Insights

Instacart’s holiday report combined a Harris Poll (2,000+ U.S. adults) with first-party purchase data to map how Americans shop and cook from Thanksgiving through New Year’s. Key takeaways: most people plan to celebrate (89% Thanksgiving), staples peak the day before, but turkey orders peak four days out, non-alcoholic options are rising (alcohol orders that also included NA drinks up 157% since 2019), and the playful Candy Cane Index shows Christmas “starts” about a week earlier than in 2017. They published this seasonal campaign in the Fall of 2024 and did a great job of including proprietary data and snackable stats. This gave editors easy headlines and local angles. It was picked up by lifestyle and local outlets such as Yahoo, What’s Up Newp, and KTVZ.
30. The Most Haunted States in the U.S.
moveBuddha (created by Green Flag Digital)

While some hide under covers in fear, others seek out America’s haunts. And while this campaign was created for Halloween spooks, its presence is felt year-round thanks to that passionate bunch that will devour anything related to ghosts, haunts, and the netherworld. This campaign sourced data from graveyards, historic homes, old towns, and more to create a proprietary ranking of the most haunted states in the U.S. The results may creep you out.
FAQs about DPR
What is a digital PR campaign (expanded)?
It’s more than one piece of content.
A digital PR campaign is the combination of components: the idea, the research, the overall story, the text content, visual content, data analysis, campaign planning, campaign execution plan, media targets, media plan, and media outreach. The way the industry usually talks about it, there are usually 1-4 campaigns run every month or every quarter.
Strictly speaking, a seasoned marketer may say that the campaign is a series of individual content pieces paired with outreach that roll up into a higher-level initiative, so those are two different ways of speaking about it. We use the former, and most in the industry do as well.
In addition, a digital PR campaign should fit into a larger marketing campaign for ultimate effectiveness. If you’re in charge of the Barbie or Oppenheimer movie launch, you’ll have a general marketing strategy, and then under that 1-3+ campaigns that support that strategy, depending on audience, channel, the 4p’s (or 7p’s) and other factors.
Unlike traditional PR, digital public relations also considers what happens after coverage is published. A successful placement can create referral traffic, backlinks, social shares, branded searches, and citations in search engines and AI-generated answers. That makes digital PR part media strategy, part brand-building, and part link building, although the best campaigns are never created solely for the link.
What are digital PR frameworks?
Frameworks in digital PR are very similar to their usage in many marketing fields – a trusted, reusable method for getting some level of consistency and reliability in landing coverage. It’s hard enough keeping up with ever-changing topics and trends that move at the speed of news, and leveraging frameworks helps bring order to the mix. Despite using frameworks as a jumping off point, every campaign tends to be pretty unique as we combine the client’s industry, their specific viewpoint, expertise, and our unique design and fresh data we find for the campaign.
Where to find some of the best digital PR examples for inspiration?
The Pudding, Visual Capitalist, and independent builders like Neal Agarwal all make things that outclass most of this list. So do a lot of the people posting to r/dataisbeautiful. We look at all of it, often.
For trending topics, we watch Google Trends. For what people actually argue about in a category, Reddit. And for what others are doing with the same numbers, Datawrapper’s river of published charts.
The most underused source is public data that already exists and has never been given a story. Most of our campaigns start there: BLS, Census, CDC WONDER, etc.
What are the best digital PR examples for brand awareness?
The best campaigns for brand awareness make the company’s name central to a memorable idea. Signs.com’s Branded in Memory experiment worked because participants tried to draw famous logos from memory, directly connecting the campaign to the company’s expertise in signs and branding.
Dream-job campaigns and visual experiments can also generate broad brand visibility because the concept is immediately understandable and easy to discuss. However, the idea still needs a credible connection to the brand. Attention without relevance rarely builds lasting brand authority.
How to pivot digital PR to your category?
Finding the story where your company is the only credible source will help earn coverage and attention for your brand. Here are some examples that could work:
- Cybersecurity. Travel-related phishing and fraud reports by state, using the FTC or IC3 data behind the Locals Insider study. The seasonal hook writes itself: out-of-office replies, public Wi-Fi, and unfamiliar booking sites all cluster in summer.
- HR and people ops. How many employees actually take a full consecutive week off in July, by industry, from anonymized HRIS or payroll data. Everyone assumes summer is when people unplug. Most companies have the data to show whether that’s true.
- Vehicle brands. EV range loss in summer heat, mapped against charger density along the most-traveled scenic byways. Testable, actively searched, and it gives you a state-by-state cut for local coverage.
- Real estate and moving. Summer is peak moving season. Quote or booking data showing where people are actually relocating this year versus last beats any survey about where people say they’d like to live.
- Travel and hospitality. Mine review data for the highest-rated version of one specific summer thing in every state. Simple, visual, fifty local angles.
- Personal finance and insurance. Cooling costs as a share of median household income by metro. Reframing a cost story as a burden story changes who covers it.
- Home services. AC and HVAC dispatch volume by week from your own scheduling data. It shows the actual shape of the summer emergency curve, which is almost certainly not the one people assume, and it doubles as an argument for booking maintenance early.
- Pet care and veterinary. Heat-related vet visits by metro, or boarding demand by week. Local news runs the hot pavement story every July, and most of them run it without data.
Update log:
- 7/24/2026 – July refresh, added summer insights, 5 new campaign examples, and reorganized/refreshed the copy.
- We just refreshed and updated this post in January, and then again in June 2026, over three years after initial publication, with some new favorites, and we expanded some definitions for clarity and to reflect our current approaches.





Leave a Reply