Which city is the most tech savvy? Which states are most vulnerable to AI? Where are you most likely to encounter bed bugs or eat Peeps at Easter?
Every one of those examples is a data-led digital PR campaign in the form of a geographic study, one of the most reliable frameworks in digital PR. Geo studies transform location-based insights into stories built to earn brands more visibility through media coverage, brand mentions, and backlinks. The branded mentions and backlinks that come with that coverage directly shape how a brand surfaces across both organic and AI search results.
If we can find a geo angle for a digital PR campaign for a given client, you can bet we will. We have seen these types of analyses build a steady cadence of links and brand mentions that real people see, share, and sometimes tear apart in the comments on social posts. Local and national media love talking about them. Big media brands have tapped into the tactic too, and now often create their own location-based rankings (CNBC, Business Insider, U.S. News, and Investopedia).
Below is a roundup of the geo studies we have seen hit local news headlines this year. (If we missed one, send it over and we’ll add it.)
Key Takeaways:
- Geographic studies come with a built in distribution strategy: A 50-state list equals 50 local angles.
- Strong methodologies win: Detailing sources and scoring logic is what earns journalists’ trust and citations.
- First-party data wins: Proprietary data is harder to copy and easier to defend.
- Seasonality gives editors a deadline: Tying a ranking to a timely cultural moment (Super Bowl, Valentine’s Day, Spring Break) can earn coverage faster.
- Repeatable studies compound: Annual updates become citation magnets because reporters can reference “this year vs. last year” and compounding links help people find the report more easily.
Click on the campaign name to jump to the explainer, or click the brand to view the study.
1. Best and worst states to retire in 2026
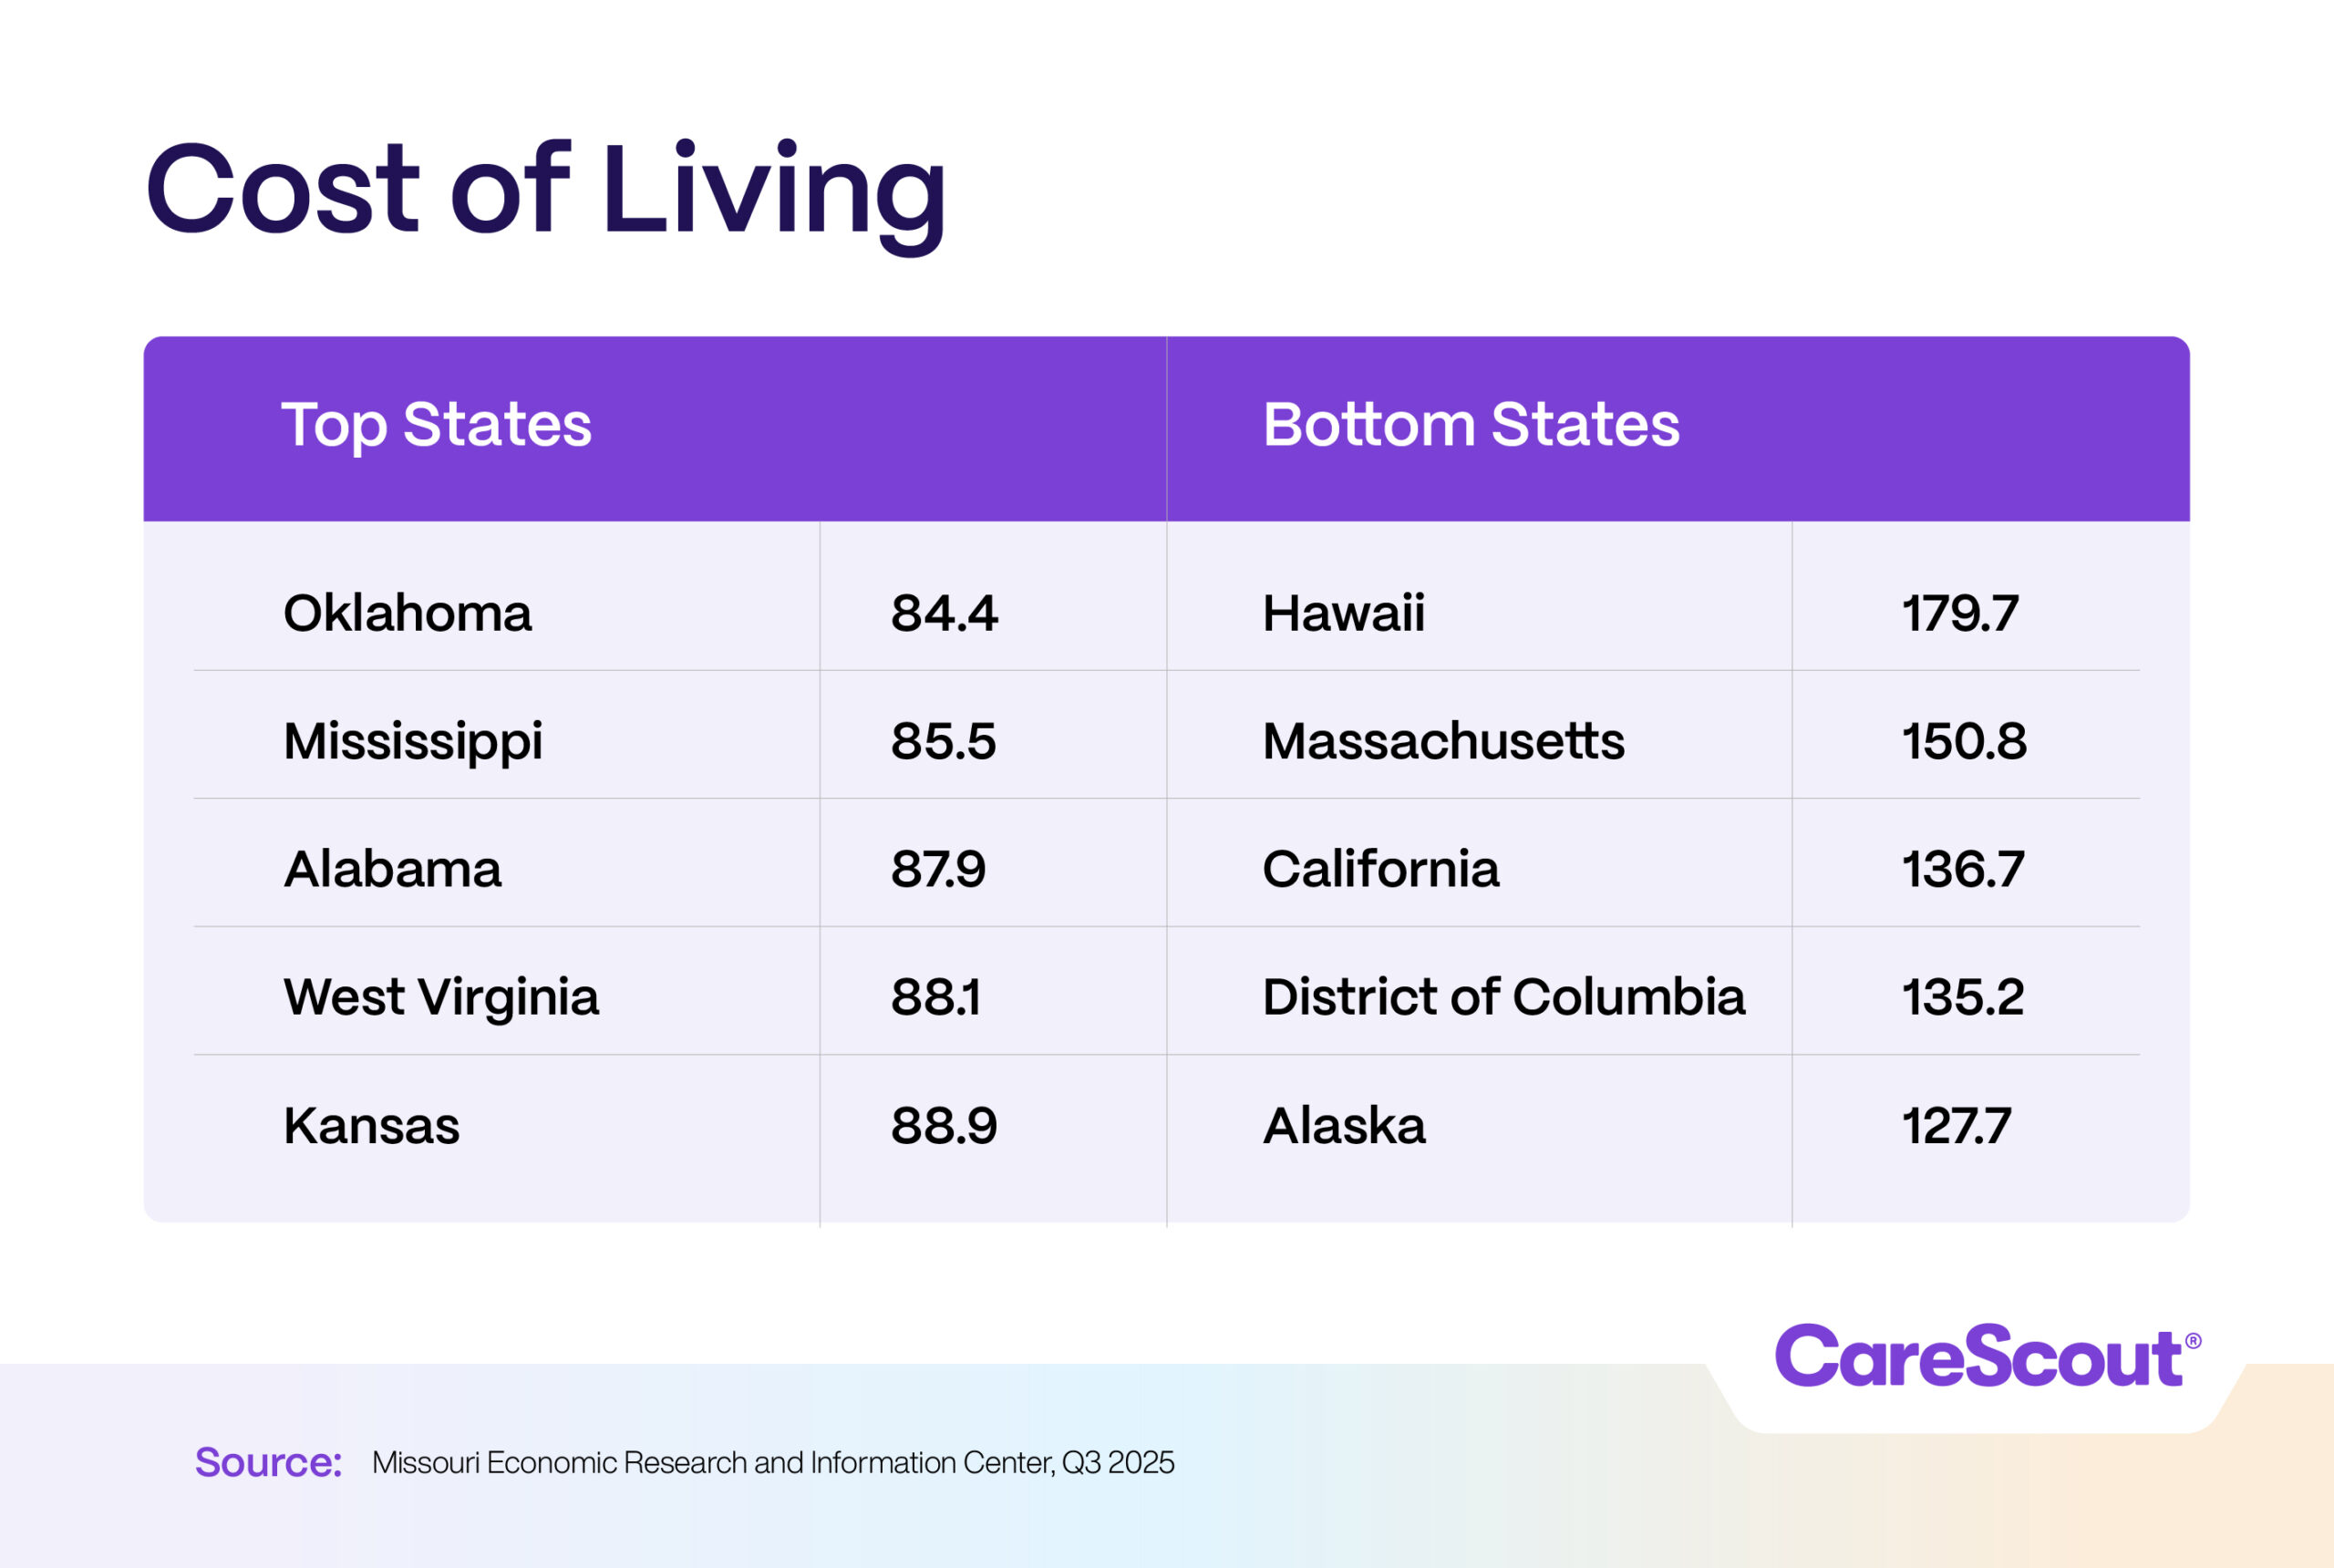
Care Scout ranked all 50 states for retirement by analyzing healthcare access, cost of living, tax burden on retirement income, and senior care quality. For a brand in the senior care space, it’s a natural fit and positions them as a trusted, data-driven resource. Every state newsroom has a reason to pick it up, and every reader over 55 has a reason to click.
2. Best & Worst States to Raise a Family (2026)
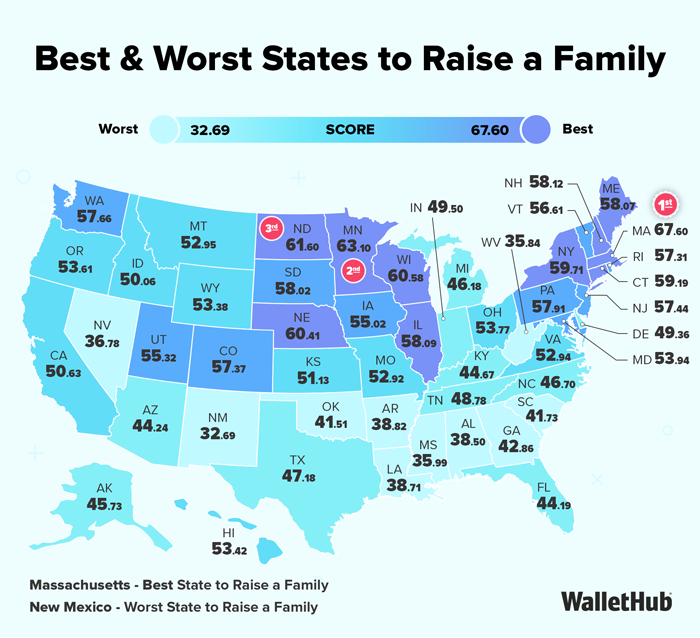
WalletHub put all 50 states under the microscope, scoring them on school quality, childcare costs, safety, and economic stability to find the best and worst places to raise kids in 2026. But this is just one of what feels like hundreds of geo-rankings WalletHub publishes every year, from the most overweight cities to the most diverse, and best cities for St. Patrick’s Day to the happiest states. They have become the undisputed king of the geo-ranking format. WalletHub’s domain authority grows a little more each time their deep data dives get covered by a media outlet. It’s a masterclass in using data-led PR as an SEO and brand awareness engine at scale.
3. Top 10 Affordable States to Start Your Business
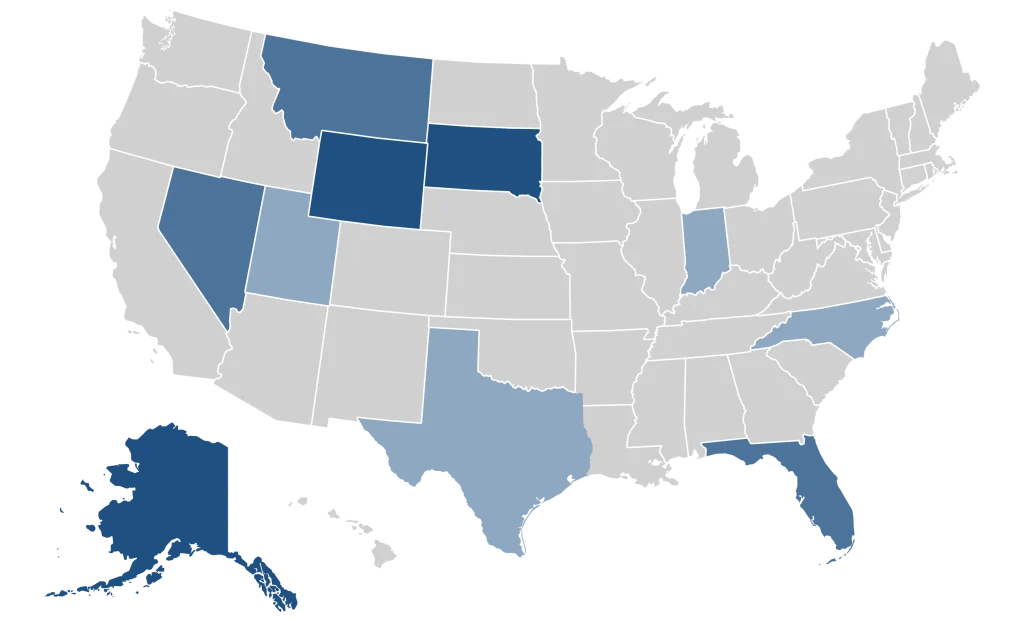
Northwest Registered Agent ranked the most affordable states to start a business, looking at tax burden, operating costs and regulatory friendliness. It’s a smart play for a brand that helps entrepreneurs set up LLCs and registered agents. The study meets their exact target audience at the exact moment they’re weighing a decision that Northwest can help them with.
4. Most Livable Metros – RentCafe

RentCafe’s annual report ranks 149 US metro areas across 17 metrics covering socioeconomics, quality of life and community to find the most livable places to rent in 2026. Washington D.C. topped the list, climbing from seventh place last year, while the Midwest dominated with six metros in the top 20. The study answers the question renters are already asking, while putting RentCafe front and center as the authority on where to live.
5. The best cities for dating in 2026
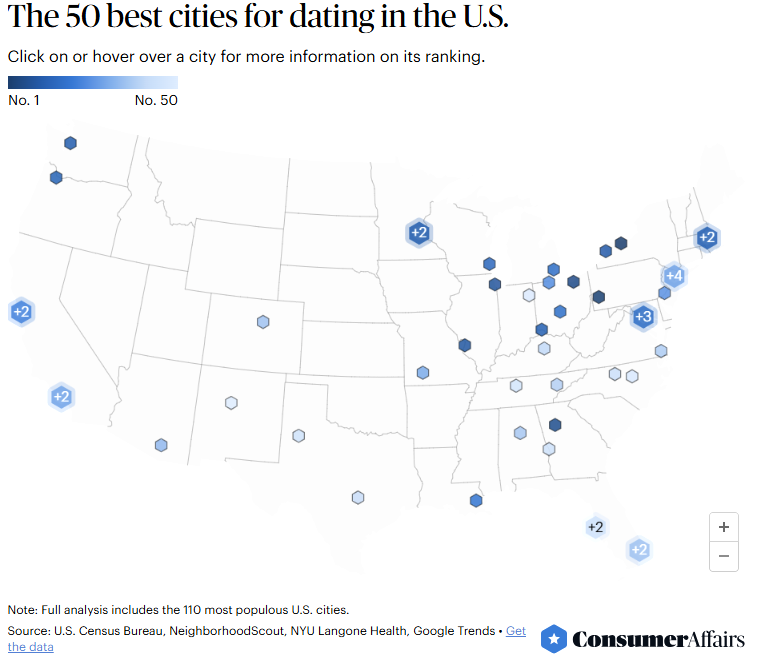
ConsumerAffairs ranked 110 of the largest US cities for dating potential, scoring each on the size of the singles pool, cost of living, quality of life, and active dating interest. Rochester, NY, came out on top for the second year running, while Colorado Springs ranked dead last. The topic is universally relatable, the results are inherently shareable (especially right before Valentines Day), and with 110 cities on the list, local media across the country had a reason to run with it.
6. Hardest-Working Cities in America (2026)
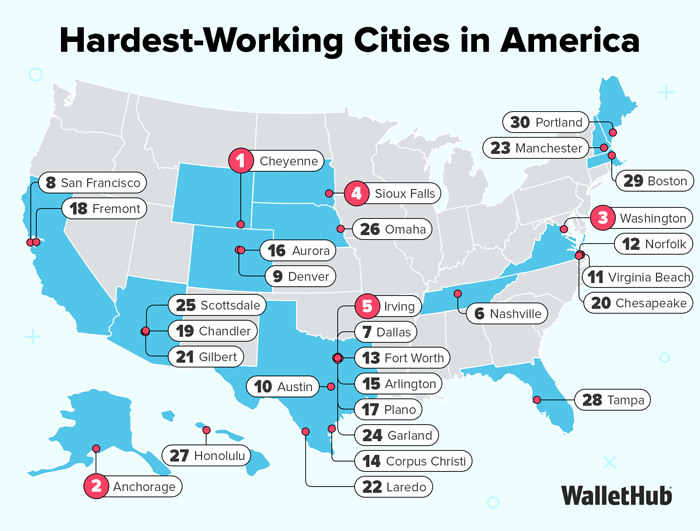
Another one from WalletHub’s seemingly endless production line. This time, they ranked 116 cities by work ethic, looking at average weekly hours, employment rates, vacation time left on the table, and side job prevalence. Cheyenne, WY took the top spot with an average workweek of 40.7 hours, and the results were picked up by Newsweek, Fox affiliates, and local outlets across the nation, with local news running their own angle on where their city placed.
7. The Best U.S. Cities to Watch the Super Bowl, Ranked
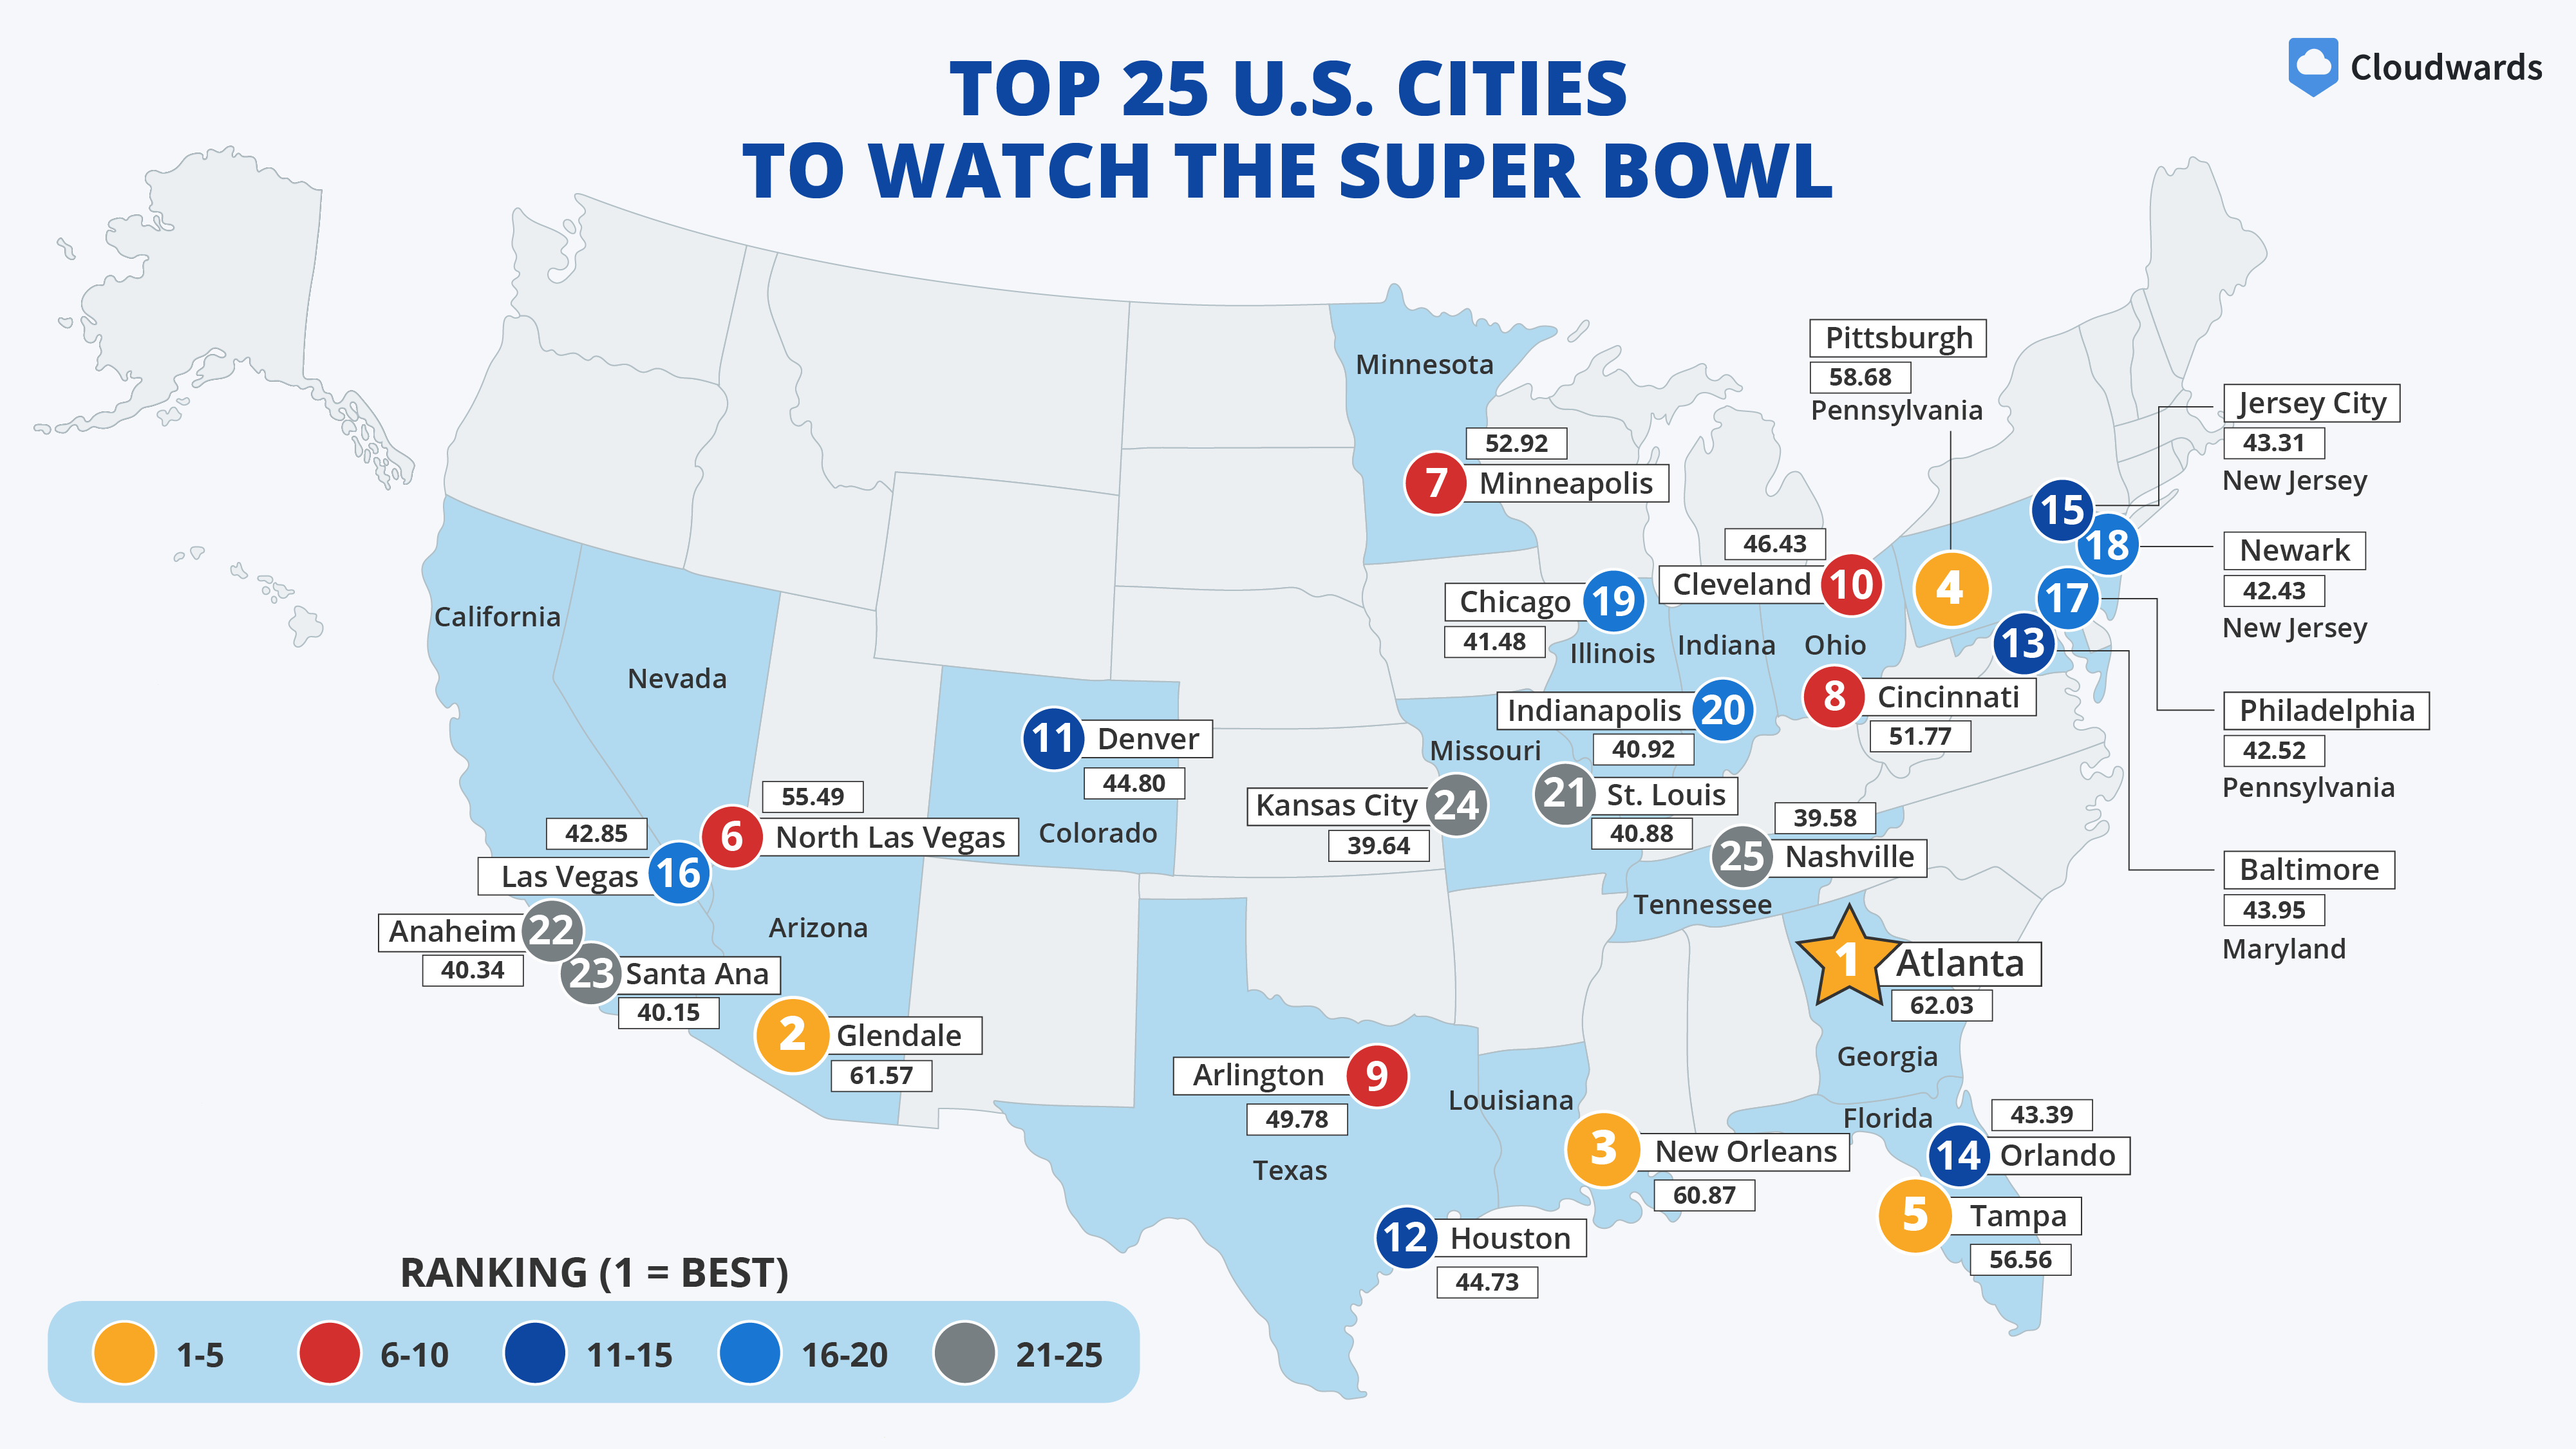
Timed perfectly ahead of the Super Bowl, Cloudwards ranked US cities by how good they are for watching the big game. Bar density, sports culture, and cost of a night out were measured and rolled up into a single score.
8. Best & Worst Cities for Football Fans (2026)
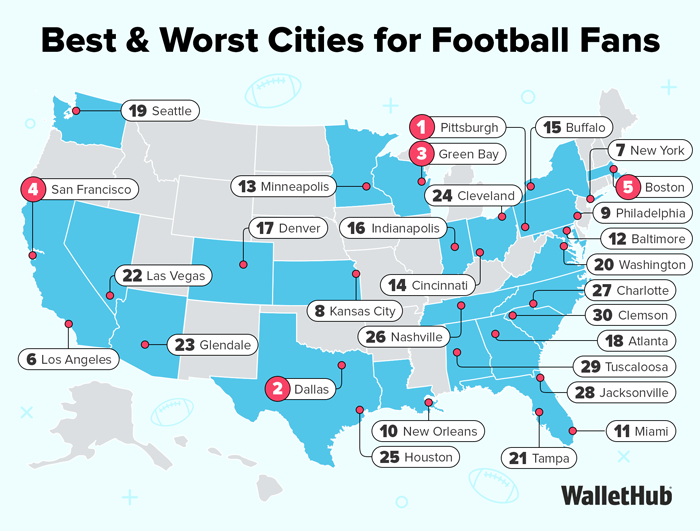
Yes, WalletHub again. This one ranked cities for football fans, factoring in stadium access, ticket prices, local team performance, and sports bar options.
9. Best State Capitals to Live In
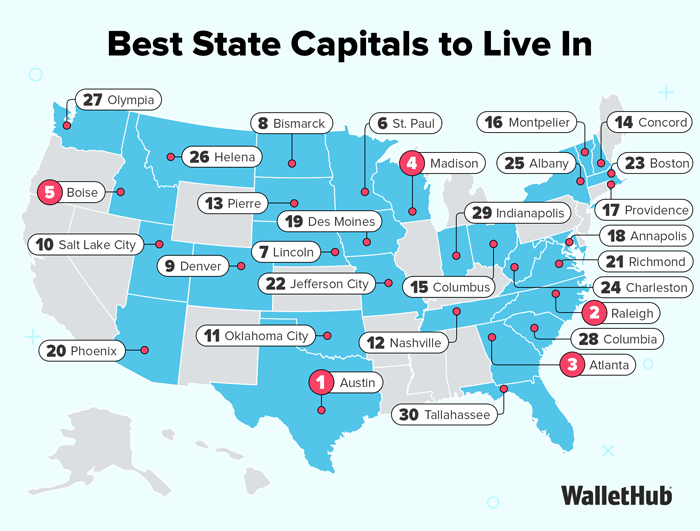
A clever geographic constraint that makes the list feel fresher than a standard best-cities ranking. By limiting it to state capitals, WalletHub guarantees coverage in at least 50 markets, because every capital city has a local paper, a TV news segment, and local pride. It’s a subtle but smart way to ensure geographic distribution of pickup without diluting the concept.
10. Best & Worst States to Drive in (2026)
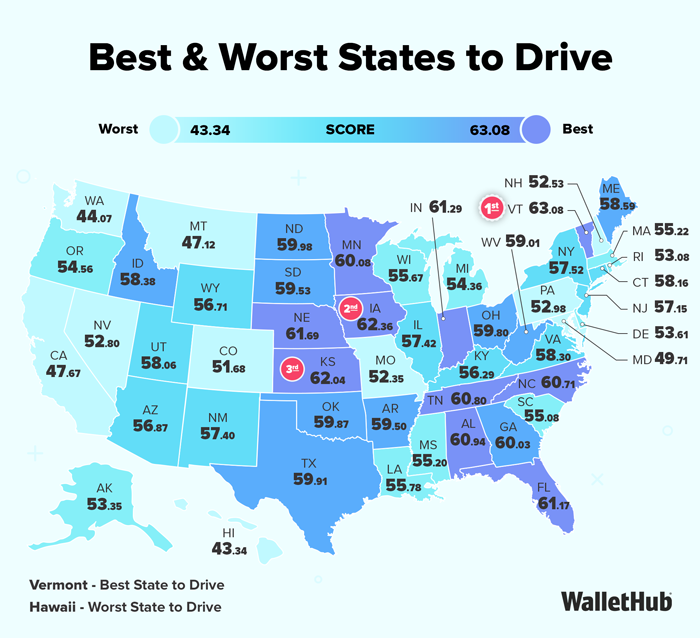
Road conditions, traffic, gas prices, car theft rates, weather, WalletHub has pulled together another deep-dive ranking, this one measuring 31 metrics. With almost every American a driver, this one has an unusually broad audience. It’s the kind of study that lands equally well in the automotive press, local news, and personal finance media, making it one of the more versatile formats in the geo-ranking playbook.
11. Planet Property: The Least and Most Affordable Cities to Buy a Home
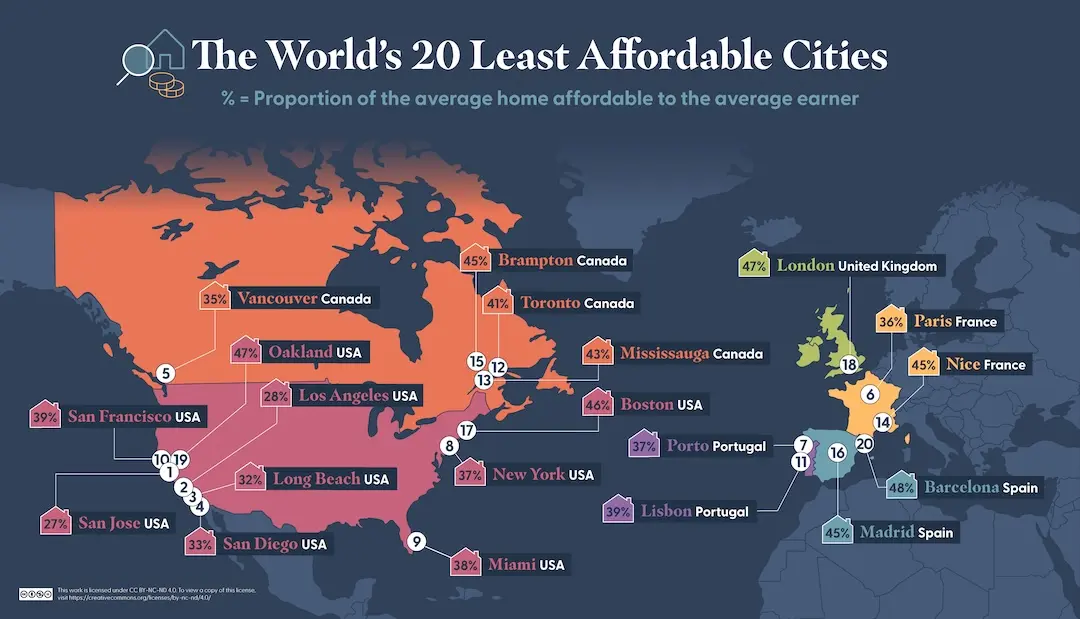
Remitly, primarily a money transfer service, used this housing affordability study to insert themselves into one of the biggest ongoing conversations in personal finance. By ranking cities on home affordability, they earn coverage from real estate outlets, personal finance media, and local news in every city on the list. The brand fit is smart too: people thinking about where they can afford to live are often the same people thinking about how to manage money across borders.
12. Where a $100K salary stretches the furthest — after taxes
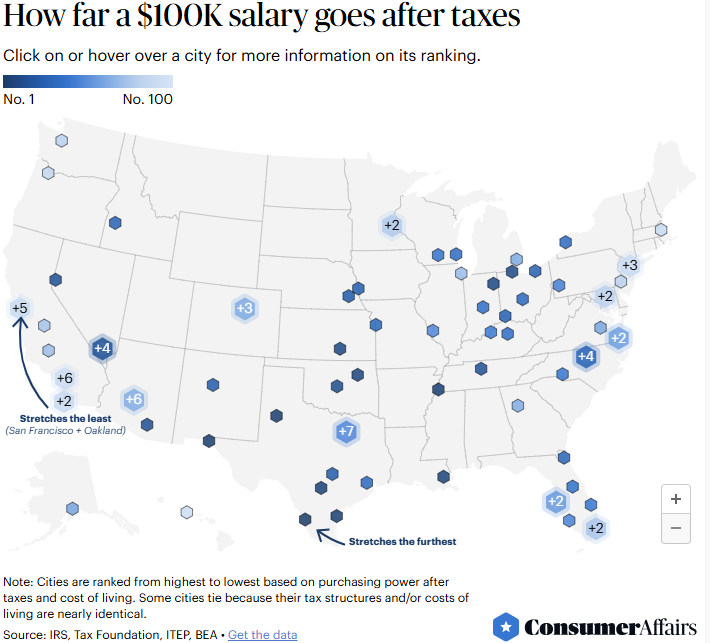
The $100K salary benchmark is a cultural touchstone right now — everyone has a take on whether it’s a lot or not enough — and ConsumerAffairs leaned right into it. By mapping purchasing power city by city after taxes, they gave readers something immediately relatable and personally relevant. This kind of “your money goes further here” framing reliably generates strong local pickup and social sharing, particularly from people in expensive cities who love to commiserate.
13. The Most Romantic Valentine’s Day Getaways [2026 Survey]
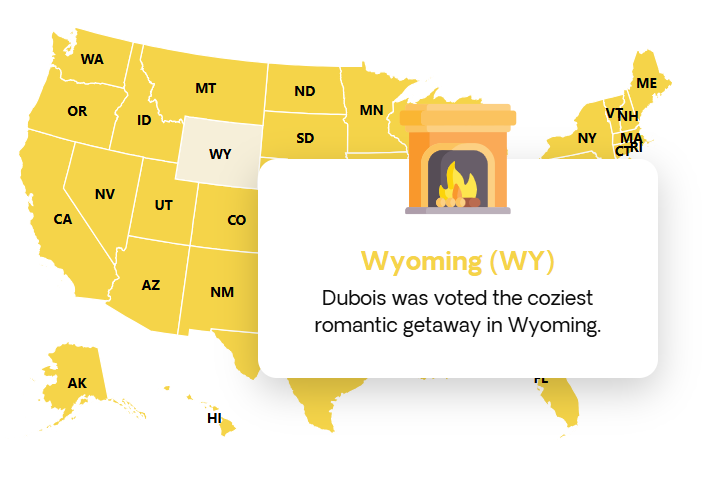
Travel brand Exoticca timed this one perfectly for Valentine’s Day, ranking the most romantic US getaway destinations based on survey data. It’s a great example of a brand using a cultural moment to earn lifestyle and Travel + Leisure quality media coverage, while the geo angle ensures that local outlets in every destination have a hook.
14. Salary Needed to Live Comfortably in U.S. Cities – 2026 Study
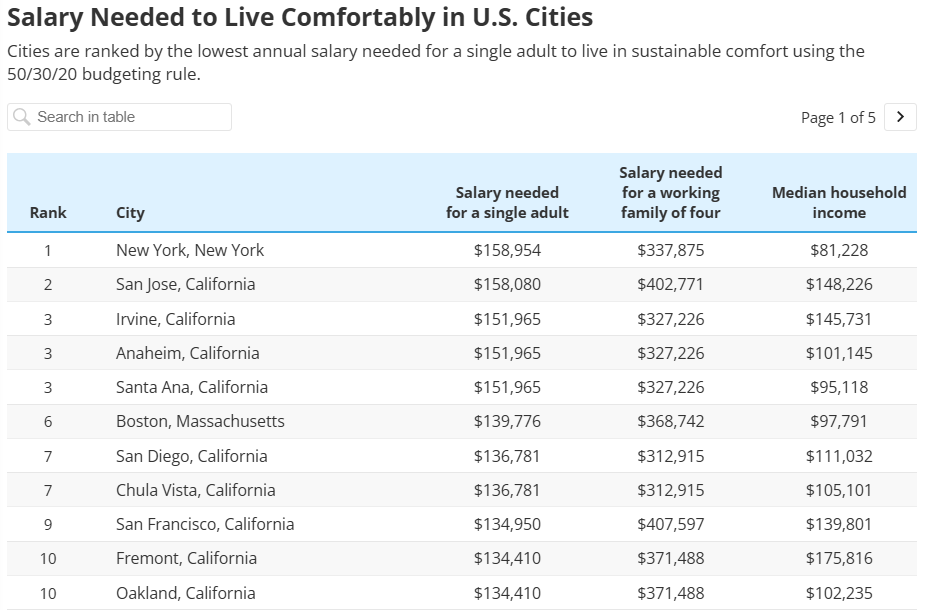
SmartAsset’s 2026 edition of this study found that a single adult needs $158,954 in New York and $83,242 in San Antonio to live comfortably. The format is evergreen, the local angles are pre-built, and SmartAsset earns a fresh wave of citations every single year. A good reminder that a repeatable study with strong geo hooks is one of the most reliable assets in digital PR.
15. Annual Traffic Index – TomTom
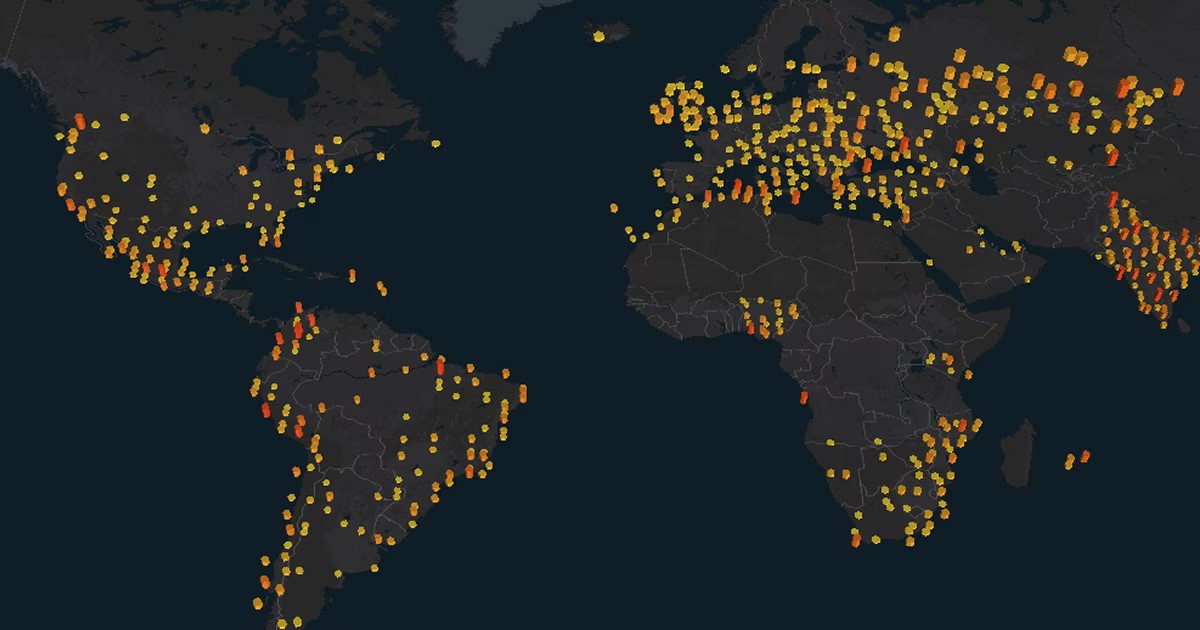
TomTom’s owns maps and location technology, so their 15th annual Traffic Index is one of the most credible traffic rankings we’ve seen. Their full index is a global report, but they make sure to cut out country-specific snapshots in major commuter locations like the United States. This year, LA topped the US congestion list, and New York remained America’s slowest city.
16. The Warmest (and Most Affordable) Winter Getaways for Retirees Revealed

Senior living brand Mirador Living combined two things their audience cares most about into one geo-ranking: warmth and affordability. It’s a tightly targeted study that speaks directly to people in or approaching a major life transition, with natural pickup in warm-weather retirement markets across Florida, Arizona and the Southwest. The brand connection to senior comfort is seamless.
17. Best Places to Invest in a Short-Term Rental with $250K or Less
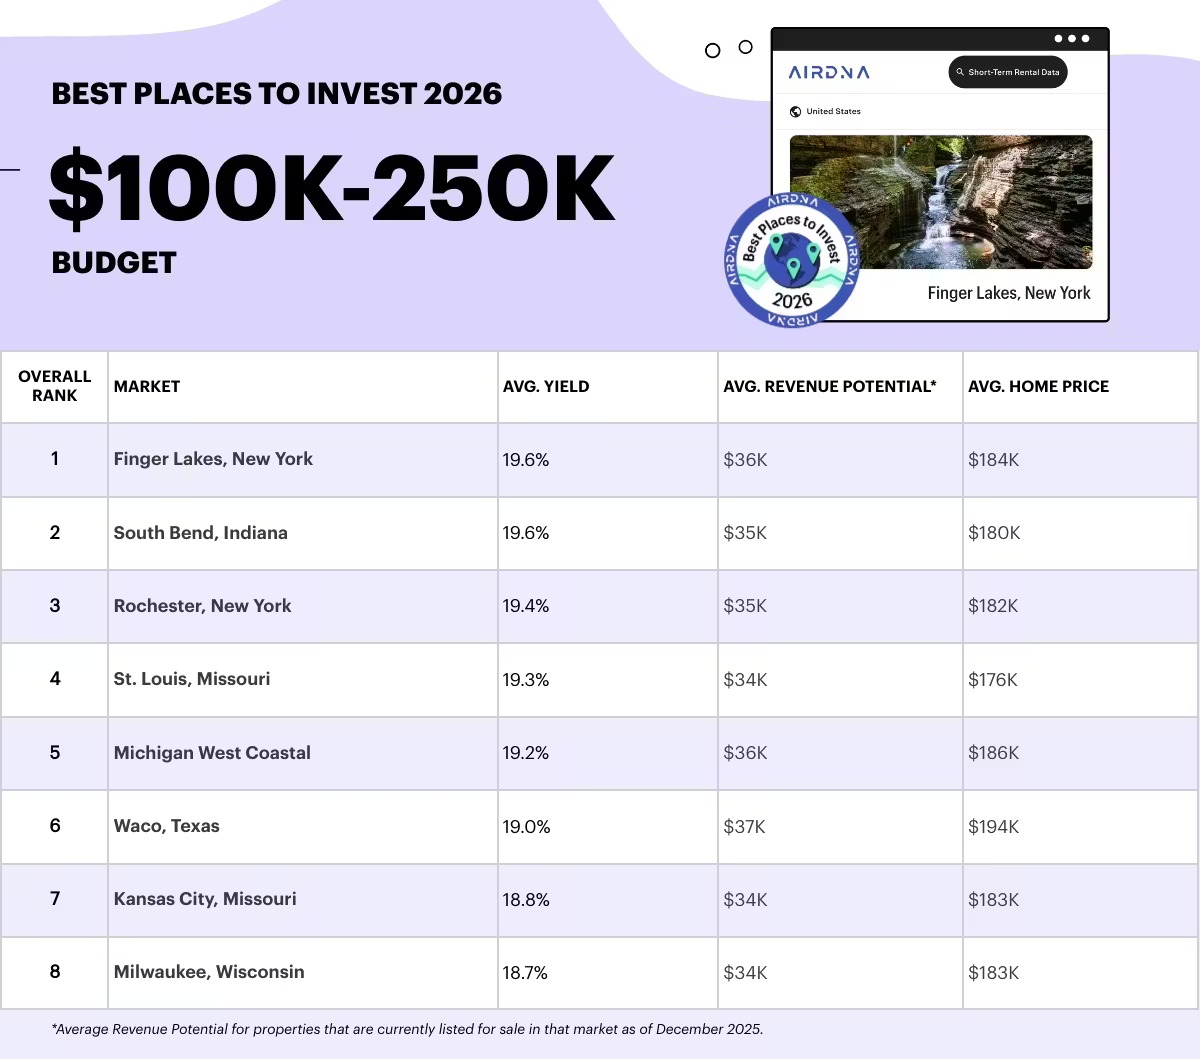
AirDNA used their own proprietary rental data to rank the best short-term rental investment markets for a sub-$250K budget. It works because the brand genuinely has the data to back it up, the audience of aspiring hosts and property investors is highly engaged, and real estate and personal finance outlets are always hungry for location-specific investment angles.
18. Paychecks Are Outpacing Home Prices in These Counties

A county-level study with a genuinely optimistic hook in a market that’s been relentlessly gloomy. By identifying where wage growth is outpacing home prices, ATTOM and Realtor.com gave local media and prospective buyers something rare right now: good news. The county-level granularity is a nice touch, going deeper than state or city rankings and giving hyperlocal outlets a very specific hook to run with.
19. The Cities With the Strongest Skilled Trades Workforce in 2026
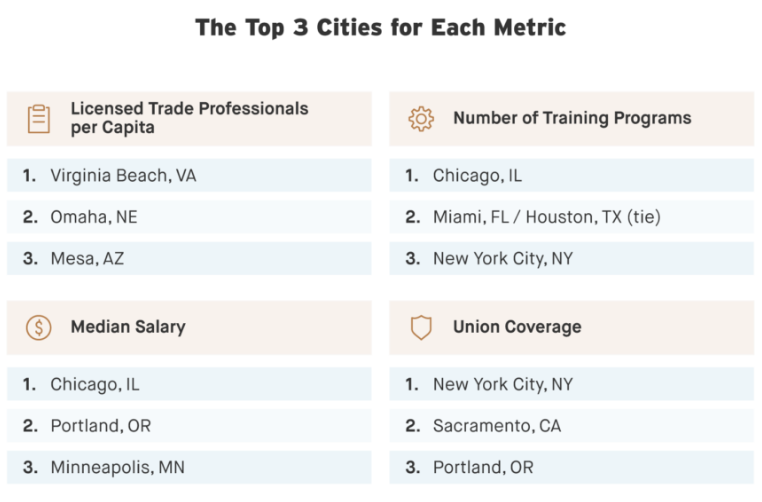
SupplyHouse planted their flag in the skilled trades conversation at a moment when workforce shortages are a genuine national story. Ranking cities by the strength of their plumber, electrician, and HVAC workforces earns them coverage in trade publications, local business press, and workforce media. A smart way to build authority in a niche while the topic has real mainstream momentum behind it.
20. Aging Well in the US: Best and Worst States for Seniors

Adjustable bed brand Opera Beds published a state-by-state ranking of the best and worst places to age well, covering healthcare, cost of living, and senior quality of life. It’s a near-identical playbook to Care Scout’s retirement study, and it works for the same reasons: the audience is huge, every state has local media ready to pick it up, and the brand connection to senior comfort is entirely natural.
21. 50 Most Affordable, Fastest-Growing Cities

MoneyLion combined two of the most-searched relocation questions into one study: where is affordable, and where is growing? That overlap is exactly what a first-time buyer or remote worker considering a move wants to know. It earns coverage from personal finance, real estate, and local media simultaneously, while giving MoneyLion a natural association with smart financial decision-making.
22. Every State’s Favorite Easter Candy in 2026, Mapped
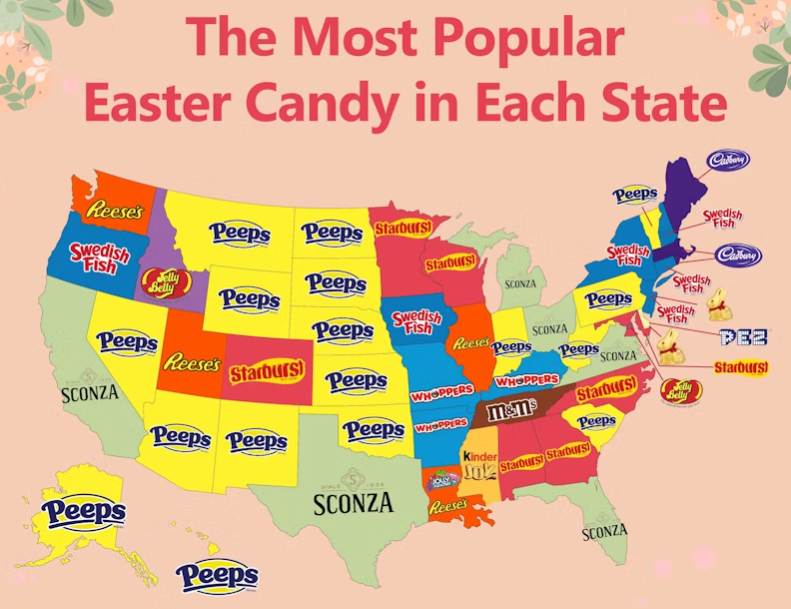
A lighter, seasonal spin on the geo-ranking format from health research brand Innerbody. Mapping candy preferences by state gives social teams something fun to run with around Easter, earning low-stakes, high-shareability coverage that builds brand familiarity without trying too hard. State pride is a surprisingly powerful sharing trigger even when the topic is whether your state prefers Cadbury Eggs or Reese’s.
23. America’s Top Third Places for Remote Work in 2026

Communications platform Nextiva ranked the best coffee shops, libraries, and coworking spaces for remote workers across US cities. It taps into the ongoing remote work conversation, the geo angle ensures city-specific media have a hook, and for a brand selling tools to distributed teams, the fit is completely natural.
24. The Luckiest (& Unluckiest) States
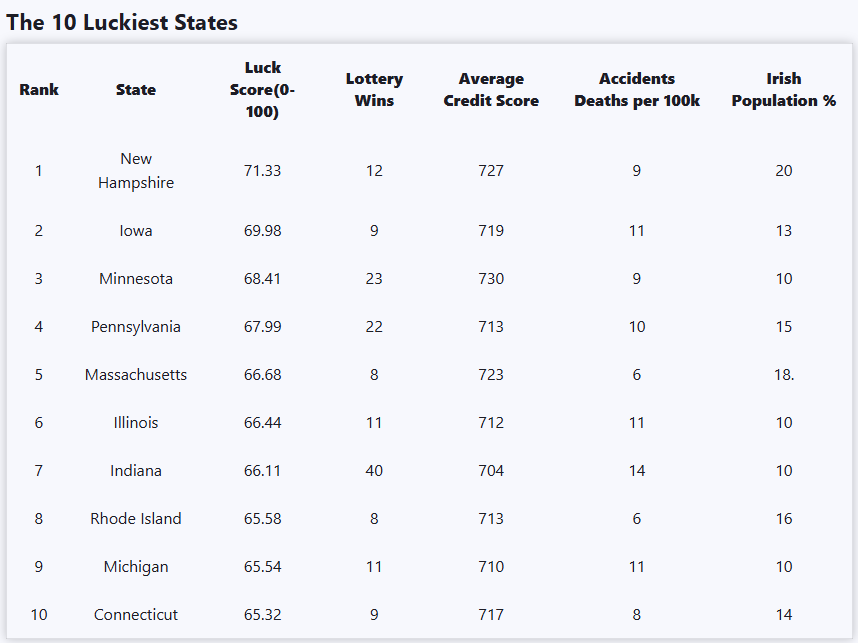
Sports betting platform Action Network ranked states by “luck,” combining lottery wins, sports championships, weather, and economic outcomes. It’s an inherently debatable concept that practically writes its own social engagement because nobody agrees on what luck means, and everyone has a strong opinion about whether their state deserves its ranking. Local TV loves this format.
25. The Most Romantic States – DoorDash

DoorDash used their own first-party order data to rank states by romance, looking at Valentine’s Day delivery trends and date-night food choices. A great example of a brand leveraging proprietary behavioral data to create a geo-ranking nobody else could publish. Timed to Valentine’s Day, it landed in food, lifestyle, and local media, with the added credibility that the insight came from real orders, not a survey.
26. Where Is It Easiest to Get Sunburnt on Holiday?
.png)
A cheeky UV index ranking from a villa rental brand, mapping sunburn risk by destination. A small brand punching above its weight with a geo-study perfectly aligned with their product and audience. The slightly counterintuitive framing, ranking places by how likely they are to burn you, makes it more memorable than a straight sunshine ranking and gives wellness and travel media something a little different to work with.
27. The Best Post-Breakup Destinations Around the World: An Anti-Valentine’s Day Guide
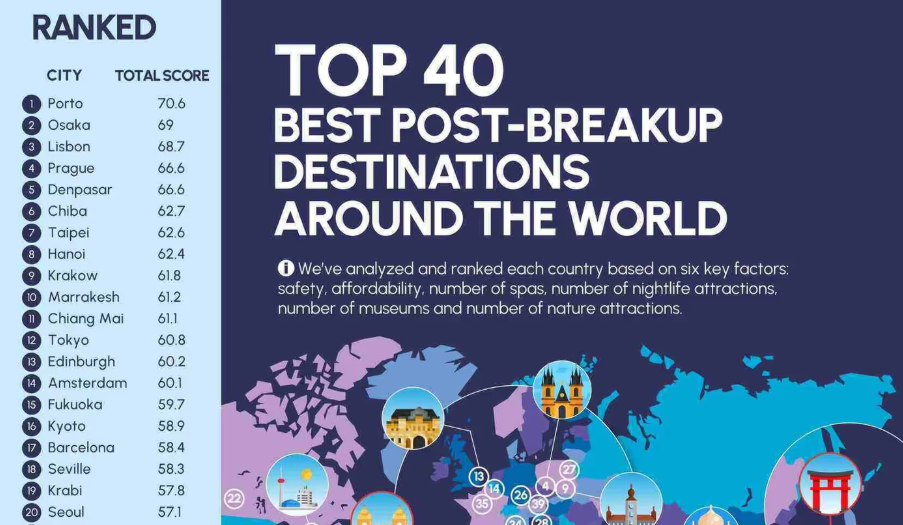
Travel eSIM brand Nomad leaned into the anti-Valentine’s Day conversation with a ranking of the best cities to heal a broken heart. While every other brand was pushing romance content, Nomad went the other way and earned coverage in lifestyle, travel, and entertainment media. Specific city recommendations gave travel writers something concrete to work with, which always helps with pickup.
28. The Fastest Growing Boomtowns Everyone’s Still Moving to Right Now
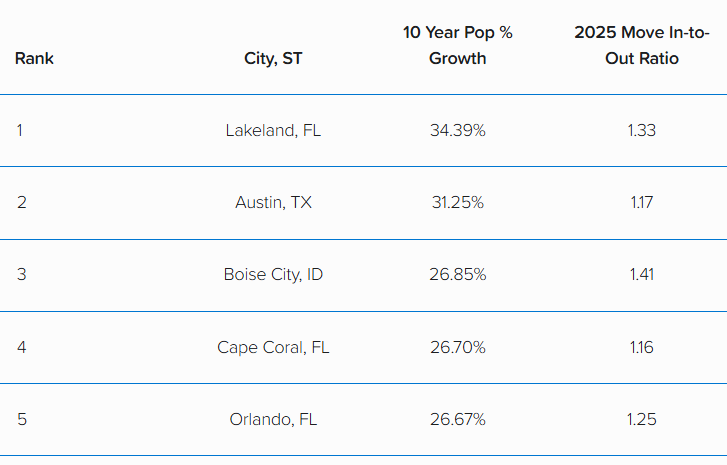
moveBuddha lined up their latest mover search data next to Census data to spotlight the places that have seen the biggest growth in the last decade and are also the ones people are still choosing to move to. The “boomtown” framing has a pull that makes it more shareable than a standard growth ranking. For a brand built around helping people move, publishing growth and migration stories is about as natural a content fit as it gets.
29. The best and worst U.S. states for allergies
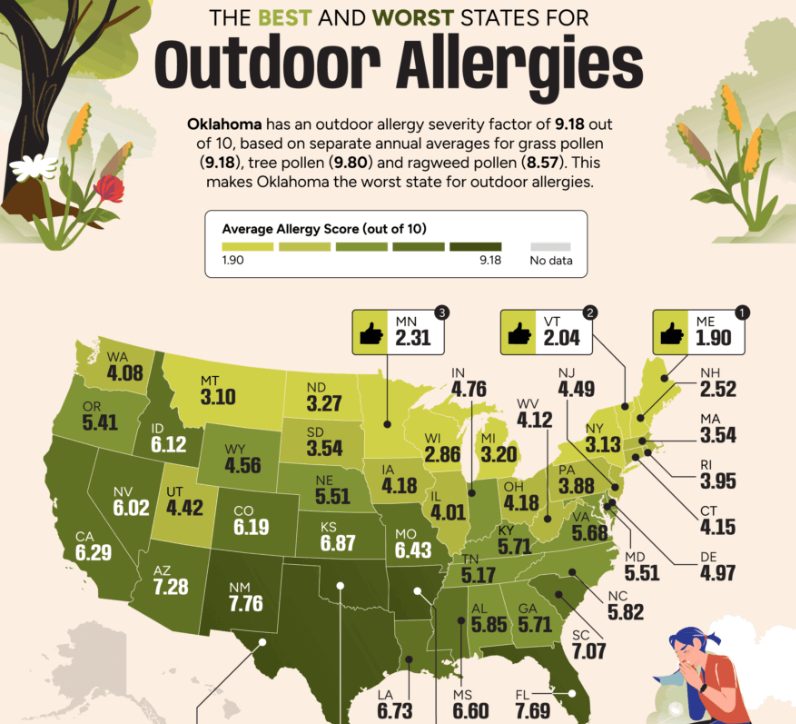
Air quality brand HouseFresh ranked all 50 states by allergy severity, covering pollen counts, air quality, and seasonal patterns. It earns coverage in health media, local news in states that rank poorly, and lifestyle publications every spring. The format is reliable and repeatable, which is half the point: they can publish it annually and local outlets will keep running it.
30. The 25 Cities Where Move Interest Is Surging Fastest in 2026
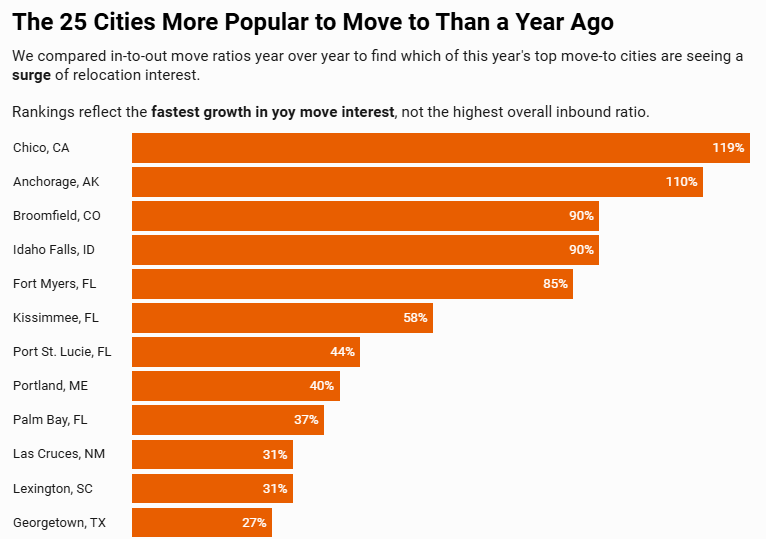
Which cities are seeing the sharpest spike in moving interest right now? moveBuddha took a different look at their proprietary data, focusing on year-over-year change, rather than another rehashing of the usual top-ten. The angle is a different way of looking at growth, focusing on momentum and gives local real estate and media a unique story hook to work with.
31. Where Gen Z workers earn enough to live alone comfortably
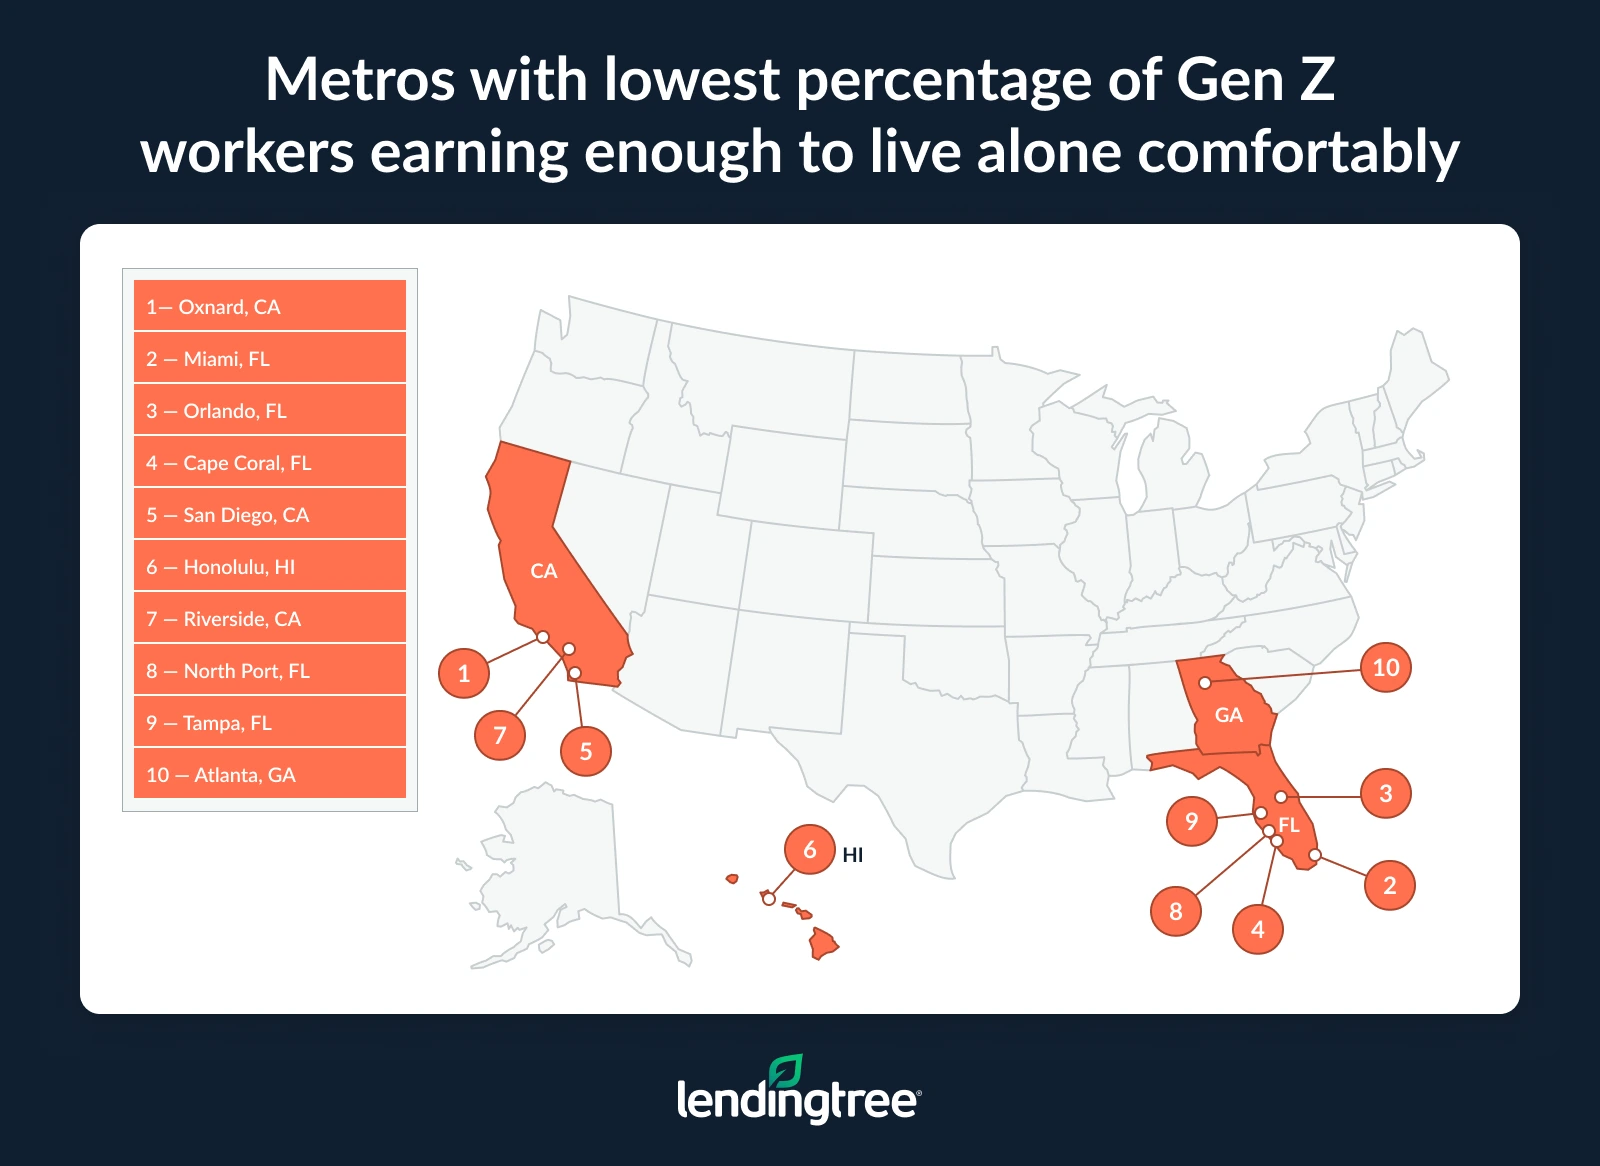
LendingTree narrowed the “salary to live comfortably” format down to Gen Z specifically, adding a generational angle on top of the geo one. That dual hook earns coverage in both youth-focused and personal finance media, and the “living alone” framing taps into a very real anxiety for young renters in expensive cities. Smart audience segmentation that makes an already-proven format feel fresh.
32. Data Study: The Best Sports Cities in the U.S. Over the Last 25 Years
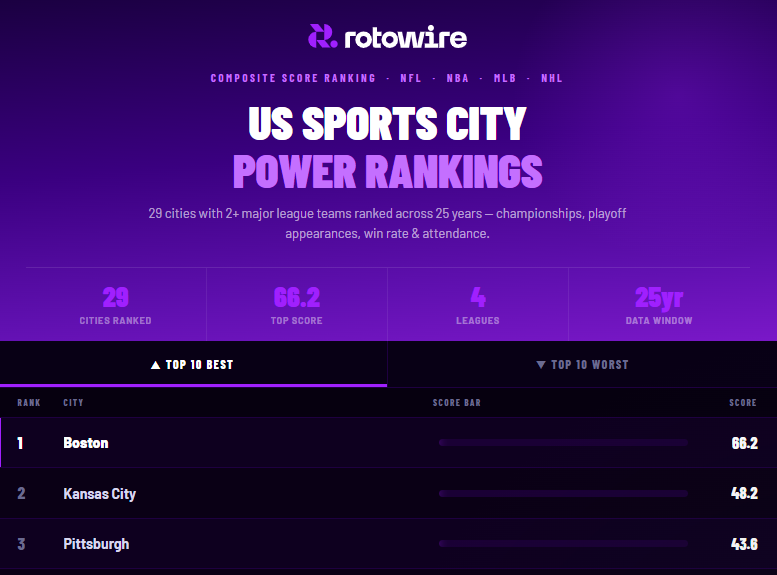
RotoWire took a longer view than most, ranking US sports cities over 25 years rather than a single season. That historical lens makes it more defensible and more debatable: fans of cities that peaked a decade ago will push back hard, which is exactly the kind of engagement you want. Sports media, local news, and fan communities all have a reason to weigh in.
33. Poll Reveals: America’s Best Spring Break Pitstop Party Towns [2026]
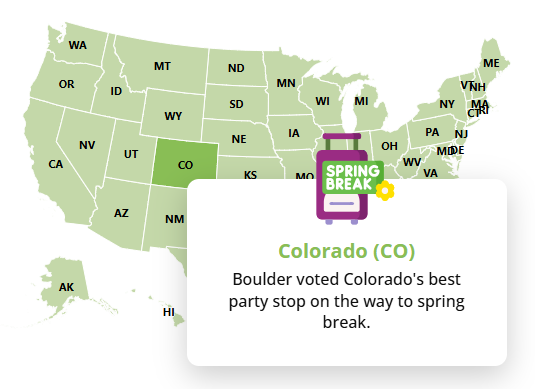
A recovery and wellness brand using a Spring Break party towns ranking might raise an eyebrow, until you realize it’s a strategically smart juxtaposition. By owning the conversation around the places people go to overindulge, they naturally position themselves as the solution. A bold content play that earned lifestyle and travel coverage while quietly reinforcing their brand’s reason for existing.
34. The Hottest Real Estate Markets in the U.S.
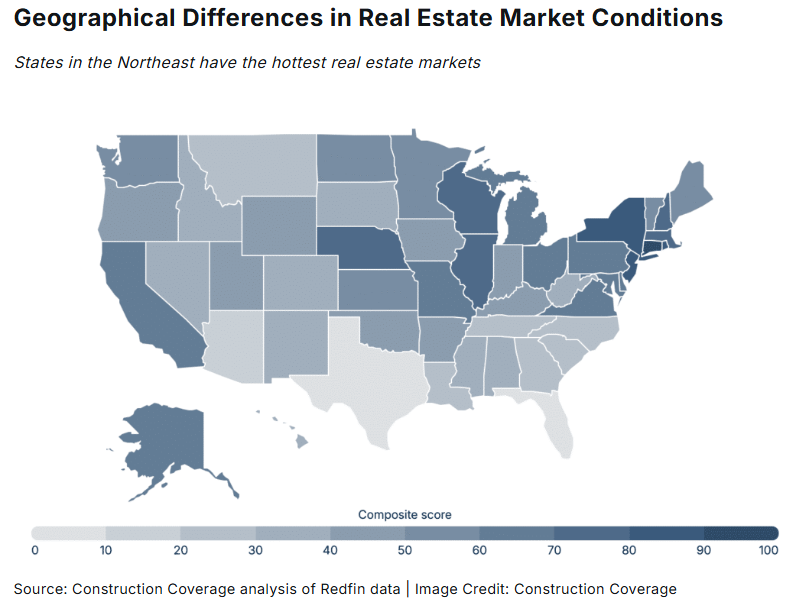
Construction insurance platform Construction Coverage regularly publishes real estate geo-rankings, and this one identifying the hottest markets by price growth, inventory, and days on market is a reliable media performer. Real estate reporters at local outlets across every major market have a built-in reason to cite it, and the brand earns quiet authority in the construction and property space without being overtly promotional.
35. Energy bills anxiety index 2026
Compare the Market flipped the typical “best places” format with a study measuring anxiety around energy bills by region, not just who pays the most but who worries about it most. The “anxiety” framing is more emotionally resonant than a straight cost comparison, earning coverage in financial wellness, consumer affairs, and local media. A good reminder that sometimes reframing what you measure is all it takes to make a familiar format feel original.
36. 2026 Moving Trends Report
moveBuddha’s Moving Trends Report is a quarterly updated report tracking where Americans are searching to move at both the city and state level using their own platform data. The ongoing cadence means it earns fresh citations each time migration trends come back into the news cycle, and the historical depth gives journalists a reliable benchmark to reference.
Conclusion
Geo studies are often connected to decisions people are already making or questions they are asking: where to retire? Where to buy? Which cities have the most jobs in “x” industry?
Regardless of what question they are asking, the most successful geographic campaigns all share:
- Clear brand fit
- Geographic scope to score coverage in multiple media markets
- Data that is either proprietary or put together in a way no one else has been able to do.
We have used this format for clients across industries and it consistently outperforms any other framework in terms of links, brand mentions, and coverage. If you want to talk about whether a geo-ranking makes sense for your brand, we’d love to chat.
Note: This is just the first iteration of this list. ChatGPT, Claude, and Ahrefs were used to help build the main table in this report, but each campaign featured was hand-selected. Part of our work and research for digital PR means we keep our eyes open for the latest and greatest campaigns making the headlines, so as we find more throughout the year, we will build upon this list.
FAQs
What is a geo-ranking study in digital PR?
A geo-ranking study is a campaign that ranks locations (cities, states, counties, regions) on a defined topic using data. The output is usually a list, map, or index with clear winners and losers. It’s a digital PR staple because it creates lots of local hooks while positioning the publisher as a credible source.
What data sources work best for geo rankings?
The strongest studies combine:
- First-party data (platform behavior, transaction trends, search demand, usage patterns)
- Authoritative third-party sources (government data, industry benchmarks, reputable indices)
- Clear normalization (per capita, per household, per square mile)
How often should you publish a geo-ranking study?
If the topic is evergreen (cost of living, retirement, housing, workforce), annual updates work well. If you have strong first-party signals, quarterly may be worth the effort. The goal is a cadence you can defend and repeat.
What kinds of brands are best suited to this format?
Brands win with geo-ranking studies when location meaningfully affects the customer’s decision, or the brand has unique data tied to geography. In practice, the best fits usually fall into a few buckets:
- Marketplaces + platforms: Travel, delivery, rentals, moving, job boards, fintech apps. If you can say “based on X million searches/orders/listings,” you’ll earn more trust and pickup.
- Location-driven categories: Real estate, insurance, personal finance, healtcare, senior living, education, commuting, energy/utilities.
- Brands that sell nationally but need local credibility or awareness: Geo rankings localize your story at scale, driving mentions that get your brand noticed in the places your audience actually reads and watches.
- Brands with a defensible point of view or expertise tied to place: Cybersecurity, HR/workforce, climate, public safety, infrastructure.
How do geo-ranking studies help with AI search results?
Coverage tends to generate brand mentions and backlinks, which support organic visibility. For AI search, the bigger win is that reputable outlets citing your data can increase the likelihood you’re treated as a source worth summarizing (AI systems look for repeated, consistent citations).


Leave a Reply