Power Laws are a mathematical concept where a small number of observations in a distribution have a huge effect while the majority of observations have little to no effect. Statistically speaking, we use power laws to identify patterns in real-world data. For example, power laws can be applied to city populations, as there are a small handful of cities that have a massive population, like New York or Chicago, and a large number of cities with small populations. And since city populations do not follow a normal distribution and are heavily skewed towards a large number of cities with small populations, the Power Law effect is at work.
Power Laws and Blog Posts
Power Laws can be applied to many distributions, but one in particular that affects the strategy of businesses is the website traffic from blog posts. Many companies create blog posts to rank higher on search engine results so that they can attract more organic traffic to their website. However, the question then arises of how many blog posts are needed to sufficiently draw in traffic. And the answer to that is found in the idea of Power Laws.
We collected data from different websites across different industries. Our findings revealed to us that only a small number of blogs actually attract traffic, and a large number of blogs attract virtually no traffic. This research highlights the idea that creating blogs is not a game of “quality over quantity,” but instead a game of “quality and quantity.” Not only do blogs need to be focused on compelling content and strategically written to rank high for keywords, but companies need to create a very large amount of them to have a chance of one or two of them achieving success and drawing in high amounts of traffic. Below we will explore how this universal law applies to many companies across different industries.
Wiz Blogs: A Power Law Case Study
Wiz is a successful cloud security company that has recently been acquired by google for 32 billion dollars. On Wiz’s website, they have produced approximately 429 blog articles related to topics such as cloud security research and product announcement/integrations. We gathered the page traffic data for all of these blog posts. The traffic refers to an estimated number of visits that a page gets from an organic search.
We split Wiz’s blog data into two parts based off their traffic: the top 10% percent of blog posts and the bottom 90% of blog posts. Now in a world where all articles are of equal importance, the first group should only account for 10% of the traffic for all blogs. However, that is not the case as we can see in the pie chart below.
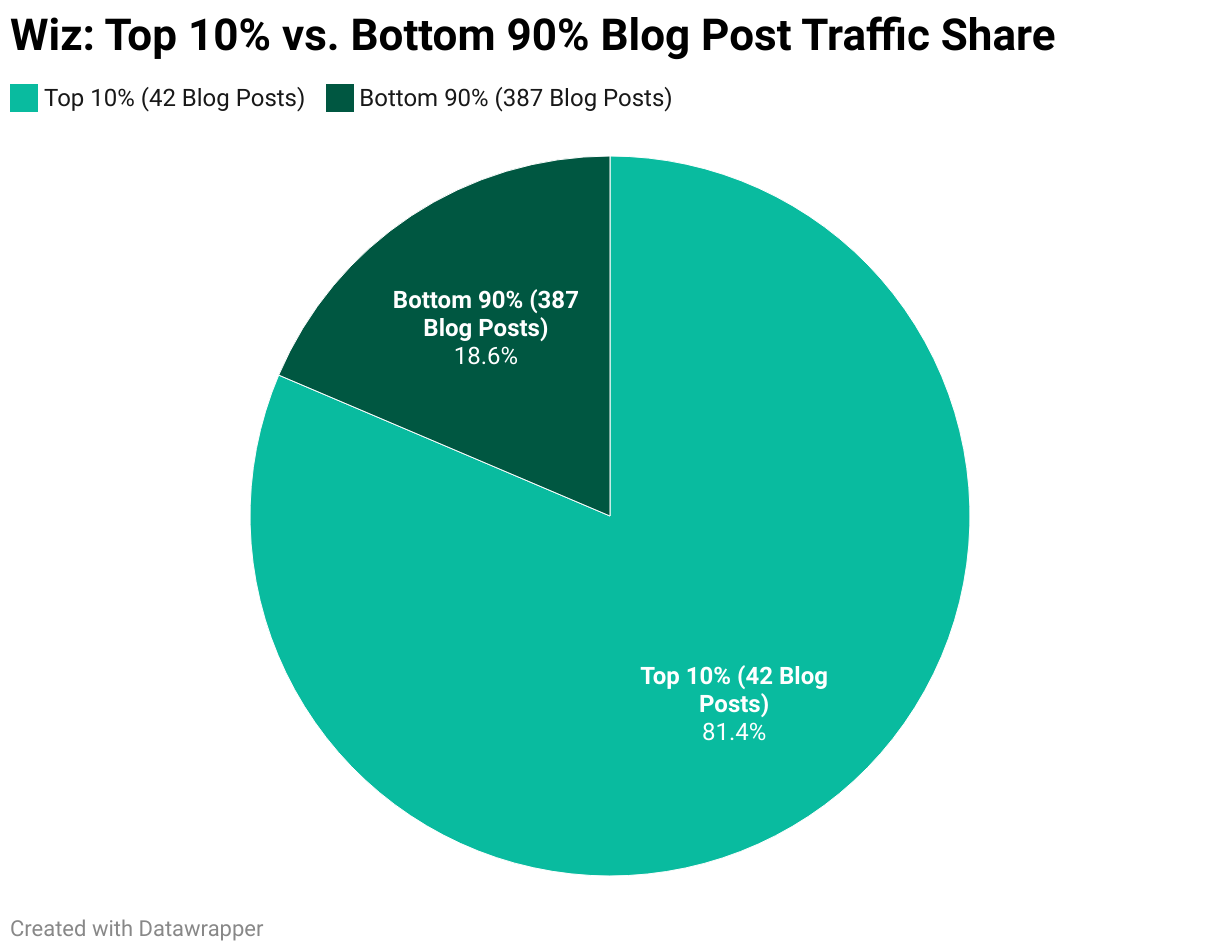
Since Power Laws are at play here, we can clearly see that our top 10% of blog posts account for 81.4% of all blog traffic. And 42 out of the 429 blog posts on Wiz’s website actually account for more than three quarters of the total traffic from blog posts.
Another common way to visualize power laws is by ranking each observation and plotting it against the variable of interest on a graph. In this case, we ranked all of Wiz’s articles from 429th to 1st based on the amount of traffic they drew in. Then we used a scatterplot to visualize the Power Law, and how the articles ranked within the top ten have high amounts of traffic, and large amounts of variability between them, whereas articles ranked from around 11th to 429th have little to no traffic and small amounts of variability.
The graph above clearly explains the concept of power laws at play. Only a small handful of blogs draw in high amounts of traffic, while many blog posts draw in a very small amount, if any at all. Wiz truly encapsulates the idea of “quality and quantity.” They produced 429 quality blog posts that were well researched and beautifully formatted, but we see that by having hundreds of them allowed a small amount to hit the rare wave of success. And their most successful articles, for example the one on exploring Spring Boot Accuator’s misconfigurations: https://www.wiz.io/blog/spring-boot-actuator-misconfigurations, account for a small yet significant amount of traffic in the totality of their website’s overall traffic.
But how far does this go? In the scatterplot above we see a flattening beginning around the blog post ranked 12th, and furthermore the top five blog posts seem are exponentially higher than all others. The pie chart below will show the effect of the top 1% of articles.
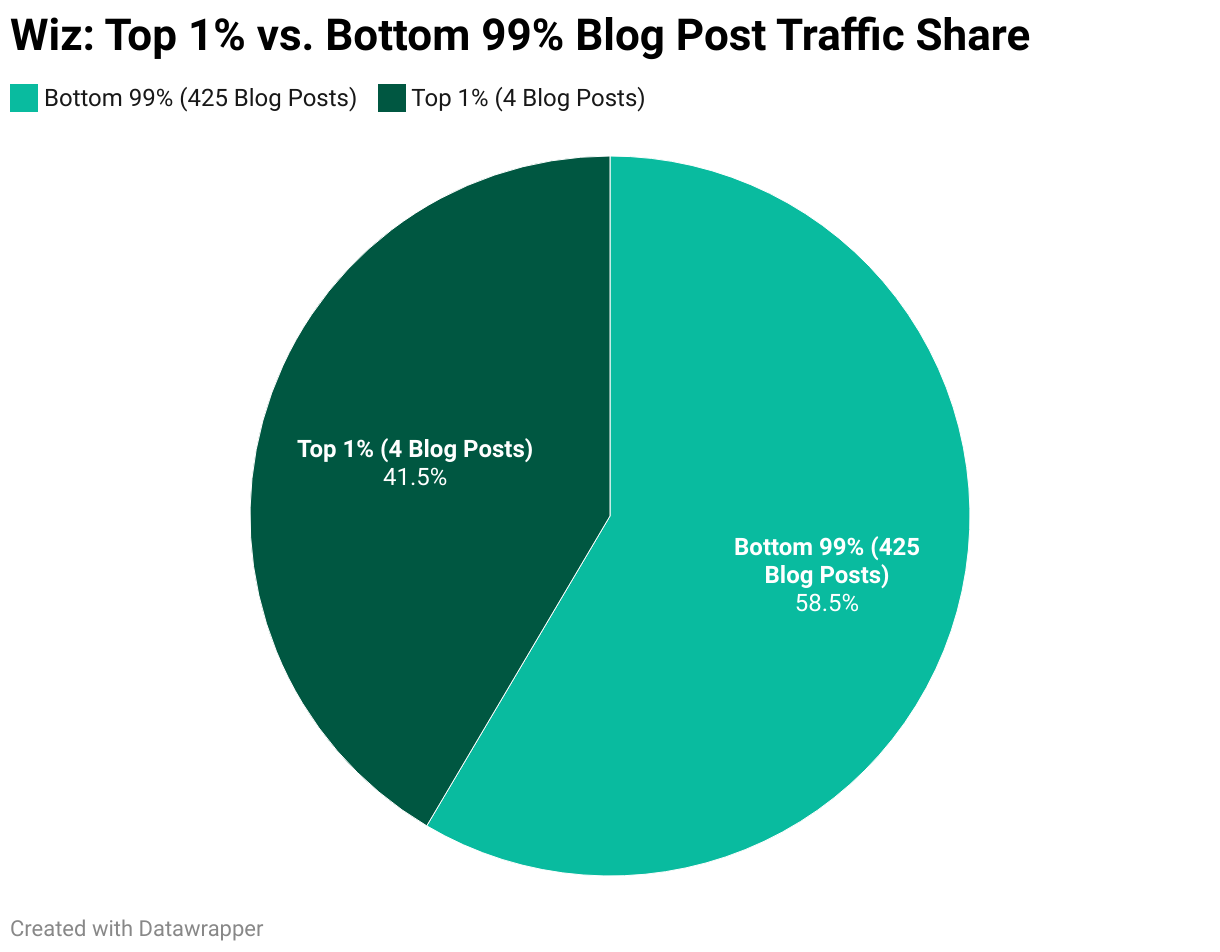
The top 1% of blog posts on Wiz’s website account for 41.5% of the total traffic derived from blogs. This jarring example explains the Power Law Effect on blog articles and the truth of how an “elite” set of articles can account for an extremely significant portion of total traffic.
Abnormal.ai Blogs: Case Study 2
As we will demonstrate in this post, Power Laws for website content exist across all industries. The fastest rising industry in the world right now, artificial intelligence, is no exception to the rule. In this study we will examine the blog posts of Abnormal.ai, a Las Vegas based company that specializes in AI powered email security services. Once again, we split all of their blog posts into the top 10% and bottom 90% and plotted the groups on a pie chart.
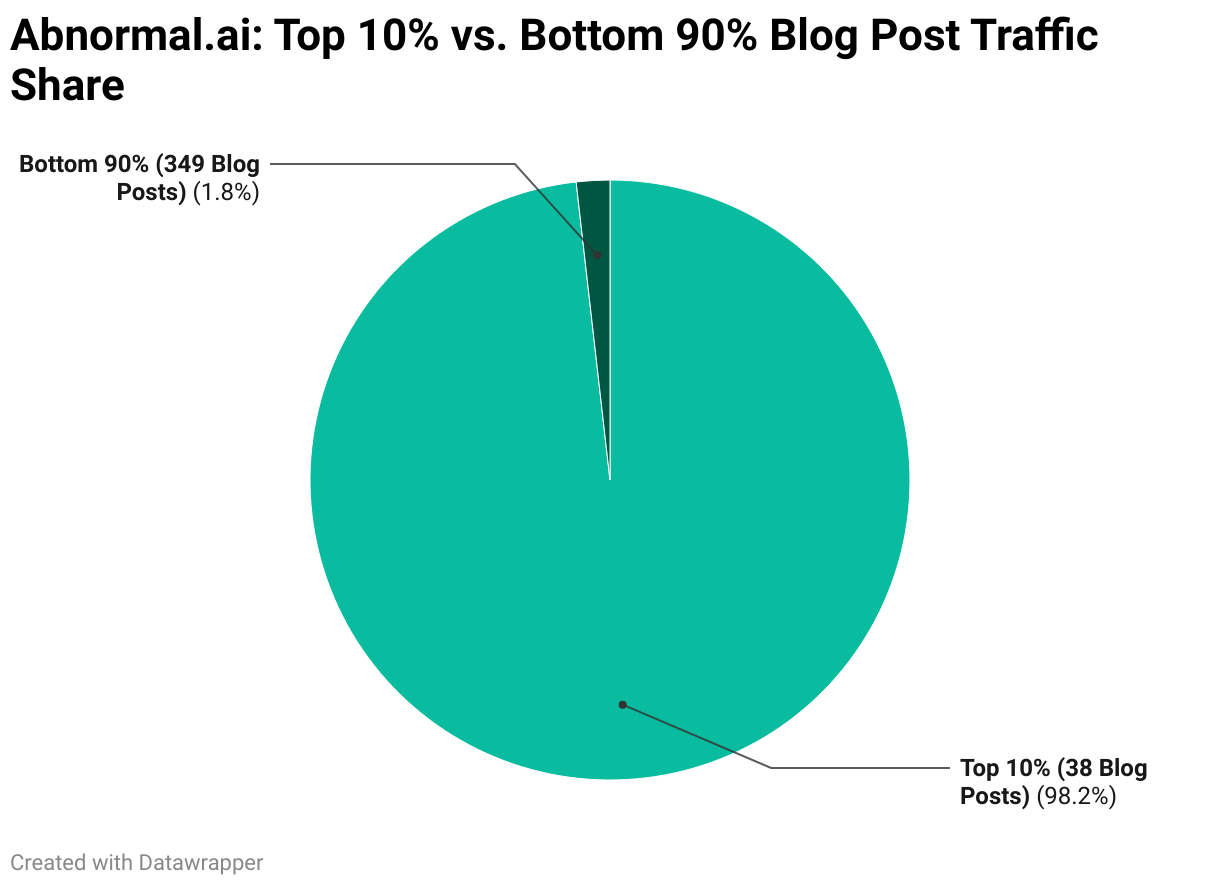
Abnormal.ai’s top 10% of blog posts account for nearly all of their entire traffic derived from blog posts. Their set of blogs follows the Power Law Effect extremely well, as 38 posts alone make up 98.2% of the total traffic from blogs, out of a total of 387 blogs.
We once again ranked all of the blog posts on Abnormal.ai’s website and plotted them on a scatterplot to reveal the Power Law Effect.
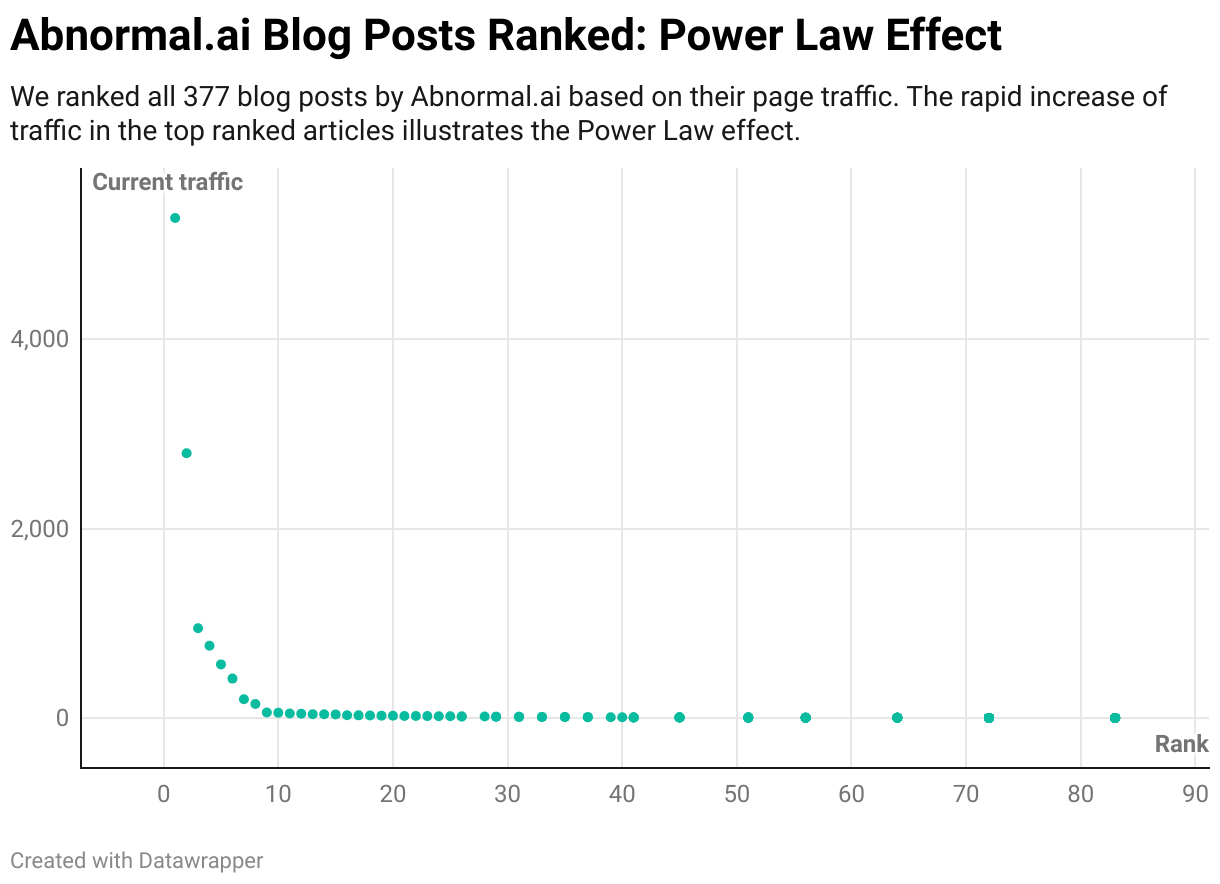
When compared to Wiz’s blog data, we see that Abnormal.ai’s flattening occurs much faster. Now this occurs because Abnormal.ai only has two blog posts that were a significant outlier in the pack. Power Law exists strongly here as the flattening occurs around the 3rd ranked article, which is .7%% of their total articles.
In fact, their top two blog posts account for 1/4 of their total website’s traffic. These two posts are research articles about GhostGPT empowering cybercriminals and a research article on WormGPT and what cybersecurity criminals are using now. These two research articles are well written and contain relevant content, which is no different than the other 375 blogs they wrote. These two just happened to draw a great amount of traffic and rank highly for search engine results. This may not have occurred if they did not have a large quantity of articles, once again reinforcing the idea of “quality and quantity.” When we look at the difference between their top 1% of articles vs their bottom 99%, this point becomes more salient.
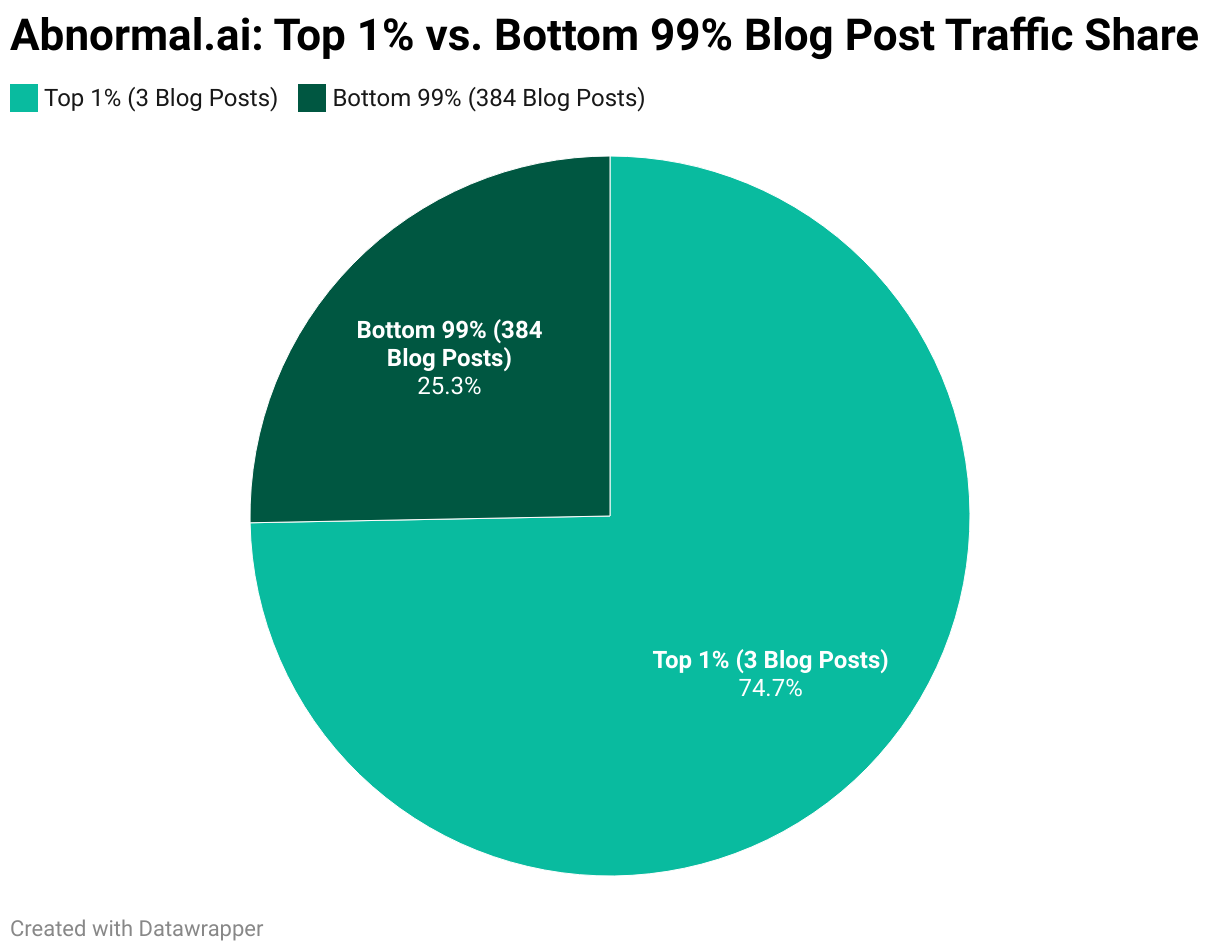
Abnorma.ai’s top 3 blog posts account for three quarters of all the traffic they derive from blog posts.
NerdWallet Blogs: Case Study 3
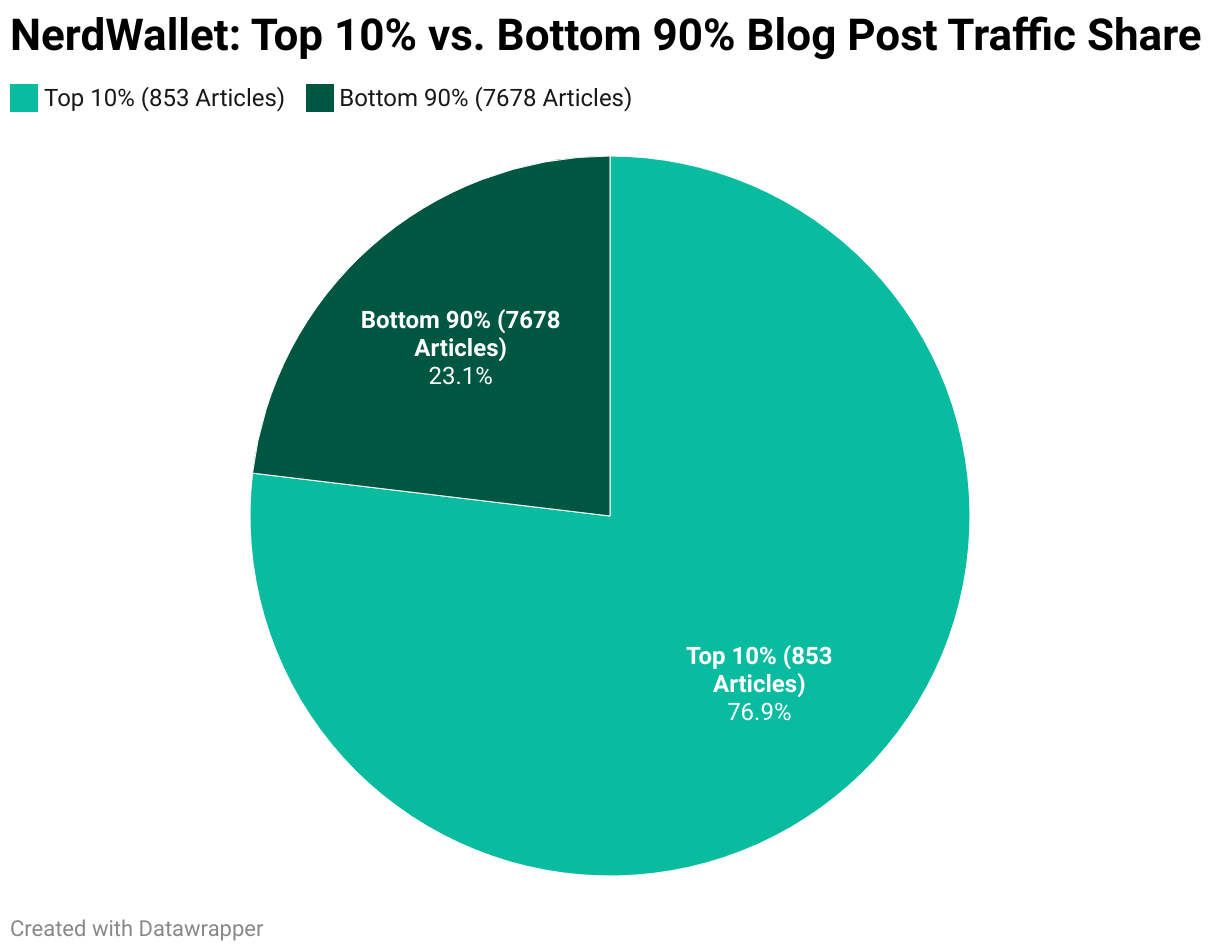
Power Laws exist even for companies who place a huge focus on content creation through articles. One of these companies, NerdWallet, is a personal finance company that produces tons of helpful content on managing money. On their website, we looked at all 8,531 articles and applied our Power Law models. Below we can see that the top 10% of NerdWallet articles account for 76.9% of all the traffic they derive from articles while the bottom 90% only account for 23.1%.
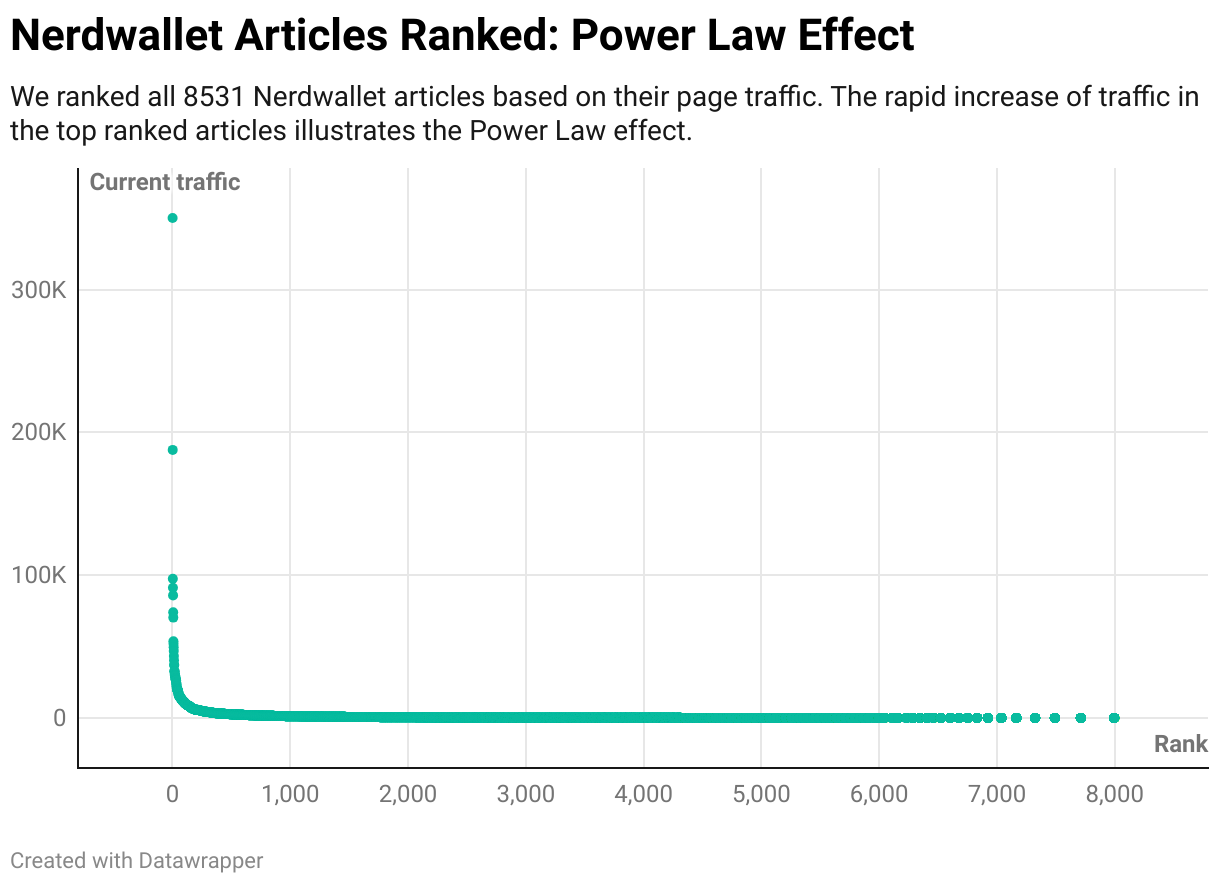
When we rank all of NerdWallet’s articles by traffic, we clearly see that only a few articles have extremely high traffic, and that a flattening occurs around the 150th article.
The Power Law Effect Exists Across More Industries
In addition to Wiz and Abnormal.ai, this universal law affects companies from other industries as well. We gathered the same data for three different companies from three unique industries and ran our Power Law model to see if the effect held. The companies and industries we chose were:
- Gusto – An enterprise software company specializing in embedded payroll (1371 total blog posts).
- Palo Alto Networks: a cybersecurity that provides advanced security solutions to protect organizations from cyber threats (596 total blog posts).
- Klaviyo – An automated email marketing application designed for businesses to easily increase personalize outreaches to customers (638 total blog posts).
Once again, we collected the blog post data for each of these three companies and split their blog/article posts into two groups: the top 10% and the bottom 90%. With this data, we created a collection of pie charts showcasing the traffic share among all blog posts for that specific company to illustrate the Power Law effect across industries.
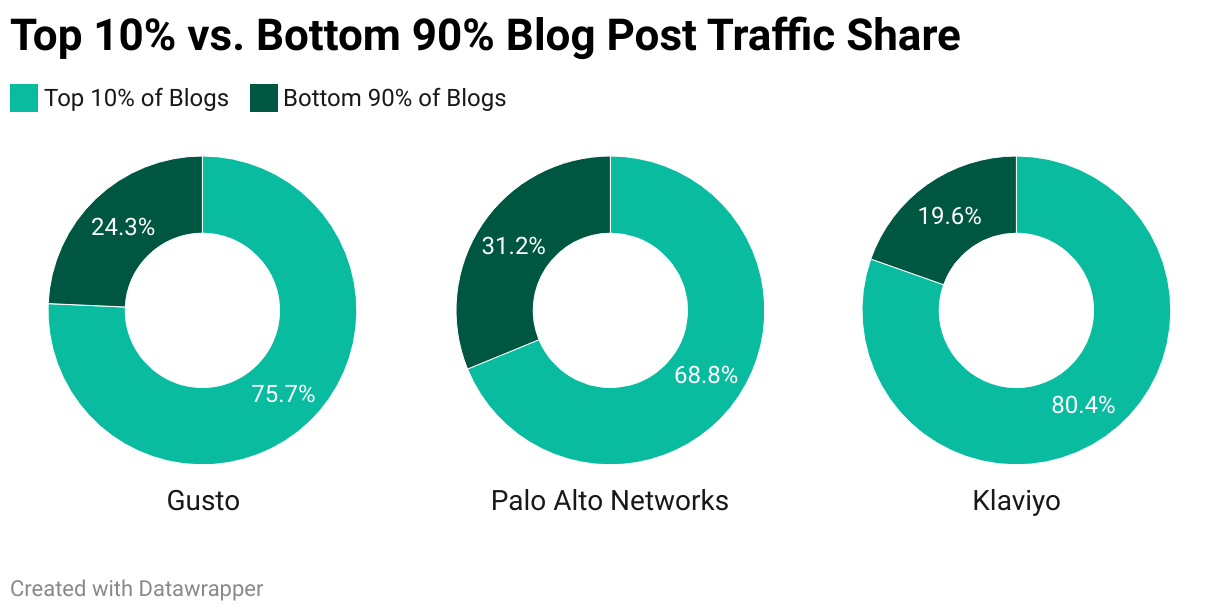
As we can see, all of the companies above have a significant portion their traffic share with their top 10% of articles. Each of these companies have a total of over 300 blog posts yet see a significant amount of their blog traffic from their top ten article. Therefore, the Power Law effect exists across industries.
The Key Takeaways from the Power Law Effect
Based on our research, we have revealed that a Power Law effect exists in blog posts and the amount of traffic they draw towards a website. We see that only a handful of blog posts actually draw traffic while the majority draw little to no amounts of traffics, reinforcing the idea that a “quality and quantity” approach is necessary for blogs to perform optimally on a given website across any industry. With the combination of relevant blogs with strategic writing, and a high number of posts, the likelihood of gaining more organic increases because of the Power Law Effect.