We researched the most compelling 2025-2026 State of Education and L&D (learning and development) reports—and we didn’t just skim the stats.
We looked at methodology, storytelling, segmentation, design, actionability, and what actually makes an education or state-of-learning trends report authoritative in an AI-saturated world.
In a time when misinformation spreads quickly, proprietary data, backed by transparent methodology and strong narrative, is one of the most powerful brand assets you can build. These companies prove it.
Below, we break down what each report does best, the insights that stood out, and the tactics you can borrow.
Key Takeaways
- AI optimism is rising—but so are concerns about cheating, over-reliance, and skill erosion.
- Engagement remains the holy grail in education—yet definitions and measurement vary widely.
- AI fluency + adaptive human skills are emerging as the dominant workforce narrative.
- Practice-based learning consistently outperforms theory-heavy models.
- The most effective reports combine proprietary data, segmentation, strong visuals, and actionable recommendations.
1. Carnegie Learning
The State of AI in Education 2025
What the example is: A 24-page survey report on education trends, specifically K-12 educator AI usage, concerns, policies, and outlook, built for administrators and teachers who want a reality check (and game plan).
Methodology: 656 respondents across 49 states + Puerto Rico (85% teachers). 10-minute survey fielded Dec 16, 2024 – Jan 27, 2025.
What we loved: The report nails the balance between clean visuals and real explanations. The standout storytelling move is their six AI user personas, which they define by frequency of use + optimism, and they even give each persona a character-style visual (AI Enthusiasts, Pragmatic Users, Skeptical Adopters, Hopeful Bystanders, Cautious Observers, Traditionalists). 40% of educators identify as cautious observers. Only 4% are traditionalists. These personas make it super shareable and very human.
Here’s what they do best:
- Use persona segmentation to humanize data
- Compare year-over-year shifts
- End with actionable recommendations for administrators
- Balance visuals with deeper narrative explanation
Standout Insights:
- AI-related cheating rose from 53% to 61% YoY
- 81% of educators are optimistic (up from 67%)
- 58% of administrators use AI often/always (up from 31%)
- 64% of teachers discussed AI with students (up from 42%)
This report works because it moves from anxiety to collaboration, positioning AI tools as enhancement, not replacement.
2. Discovery Education
Education Insights 2025-2026: Engagement Fuels Learning
What the example is: A 50-page report capturing the perspectives of 1,398 K–12 superintendents, principals, teachers, parents, and students in the United States. Conducted by Hanover Research on behalf of Discovery Education in May 2025, the findings offer meaningful insights into the real experiences of educators, students, and families in the United States.
Methodology: 1,398 stakeholders surveyed (May 2025) + live interviews.
What we loved: Their “What You Can Do” sections. This isn’t just research, it’s a field guide.
Here’s what they do best:
- Define engagement across cognitive, behavioral, and affective dimensions
- Expose engagement perception gaps (teachers: say 45% of students are engaged vs the students themselves: 63%)
- Blend quantitative + qualitative insights
- Provide classroom-ready recommendations
Standout Insights:
- 90%+ of educators say engagement predicts achievement
- 8/10 students report weekly boredom
- 79% say cell phone use disrupts learning
- Only 55% of parents believe their child is actively focused
Engagement is the lever for deep learning. Discovery Education does a great job of diving deep into what engagement really means (and how that differs from parents to teachers to students), and how educators can help improve it for their students.
3. Microsoft
2025 AI In Education
What the example is: a 43-page, highly designed global report on how education leaders and students are adopting artificial intelligence, what’s working, what’s worrying them, and how institutions can move from “AI hype” to responsible implementation.
Methodology: Conducted with PSB Insights among 1,851 respondents across the U.S., U.K., Australia, Brazil, Japan, and Saudi Arabia; fielded Feb 13 – Mar 9; global data weighted using World Bank education spend estimates.
What we loved: This report is very scannable for something research-heavy. It’s structured into clear chapters, uses strong spacing and visual hierarchy, and it repeatedly does the thing some reports forget: it tells you what to do next, not just what to worry about.
Here’s what they do best:
- Tie education to workforce readiness without making it sound like a corporate memo.
- Back up recommendations with survey detail (they literally publish the extended data).
- Name the “training gap” explicitly: leaders often think training exists; educators/students report they haven’t received it.
- Use design as a comprehension tool (visual hierarchy, pull quotes, chapter framing), not as decoration.
Standout Insights:
- In the U.S., the share of students and educators who use artificial intelligence “often” for school-related purposes jumped by 26 points and 21 points, respectively—a steep adoption curve.
- Concerns remain, with plagiarism/cheating still a top educator worry — and in the survey details, 36% of U.S. K–12 educators list “increase in plagiarism and cheating” among their top concerns (leaders and IT leaders track more toward privacy/security and resourcing).
- 70% of job skills may change by 2030 due to AI
- 78% of leaders are considering hiring AI-specific roles
This report bridges education and workforce better than most.
4. Coursera
2025 Global Skills Report

What the example is: Coursera’s 2025 Global Skills Report is the seventh annual look at how learners worldwide are building skills, which skills are surging, and how global economies stack up on workforce readiness
Methodology: Data from 170M+ learners across 109 countries (Mar 2024–Feb 2025).
What we loved: This report does more than list trending courses, it turns platform-scale learning behavior into global insights that policymakers, educators, and employers can act on. The newly introduced AI Maturity Index is a highlight: it benchmarks how prepared countries are to leverage AI innovation and economic growth, complementing the traditional country skill rankings.
Here’s what they do best:
- Blend big-data scale with economic context, combining learner behavior with macro indicators to make the insights meaningful beyond the platform.
- Introduce practical benchmarking tools (AI Maturity Index) that help leaders spot gaps and opportunities.
- Highlight regional trends and accessible, downloadable versions for six world regions.
- Showcase where micro-credentials add real value to both learners and employers.
Standout Insights:
- GenAI is now the fastest-growing skill category, with millions of enrollments indicating explosive learner interest.
- The AI Maturity Index identifies leaders like Singapore, Denmark, Switzerland, and the United States in AI readiness.
- Micro-credentials are increasingly valued by both students and employers, and are critical for closing skills gaps in business, data, and technology.
Coursera’s report succeeds because it benchmarks progress, identifies gaps, and guides strategy for educators, governments and enterprises. It’s a model for how proprietary platform data can speak to global priorities and workforce readiness in 2026.
5. Duolingo
2025 Duolingo Language Report
What the example is: The 2025 Duolingo Language Report presents the latest language trends and learner behaviors based on data from millions of Duolingo learners around the globe.
Methodology: Duolingo’s learner behavior data (Oct 2024–Sept 2025).
What we loved: The report is simple + on-brand + culturally relevant. Unlike many of the other aforementioned reports, with downloadable PDFs or corporate-styled slide decks, this report lives on the Duolingo blog, and so operates not just as a report but as a form of digital PR.
Here’s what they do best:
- Leverage product-scale data: Insights are rooted in real user behavior.
- Make trends culturally relevant: Findings intersect with geopolitics and pop culture.
- Package data visually: Charts and rankings are built for redistribution.
- Earn repeat global coverage: The report functions as an annual media moment.
Standout Insights:
- English holds the top spot in far more countries (154) than before and saw a double-digit percentage increase in global popularity.
- Chinese, Korean, and Portuguese emerged as some of the fastest growing languages globally.
Smaller brands won’t have Duolingo’s scale, but the takeaway still applies: proprietary user data, when distilled into simple, defensible stats, is easy to package, pitch, and share.
6. Quizlet
How America Learns Report 2025
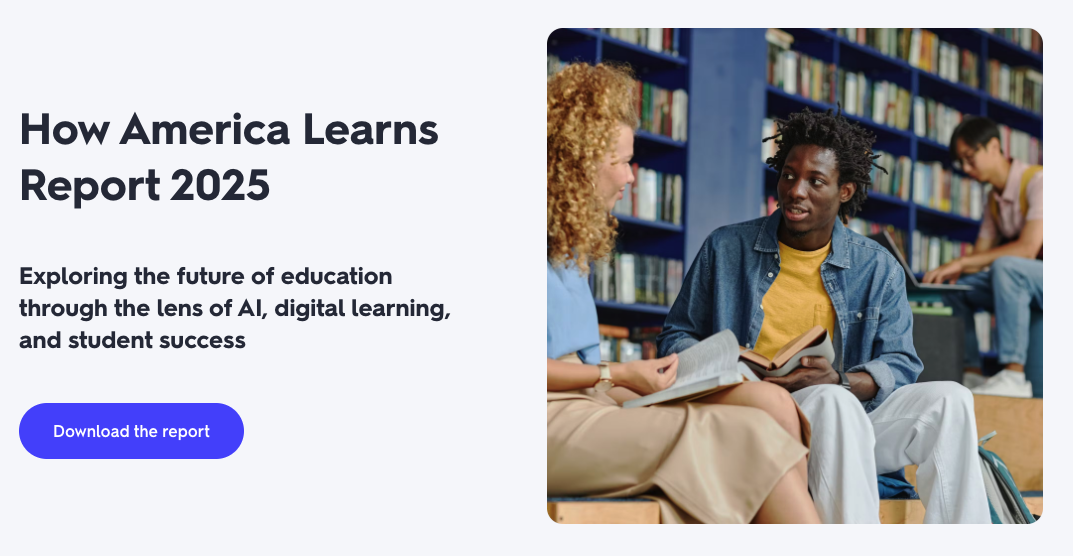
What the example is: A report exploring the future of education through the lens of AI, digital learning, and student success.
Methodology: A mix of quantitative survey and segment analysis from thousands of students, teachers, and parents. 2,003 respondents (April 2025).
What we loved: This year’s edition goes beyond AI adoption and includes digital learning equity and real-world skill priorities—positioning the data as more comprehensive and context-rich. It also frames AI not just as a tool but as a lens for rethinking learning, digital fluency, and broader student success indicators.
Here’s what they do best:
- Keep the report concise and timely. It’s only a few pages long but it zeroes in on what matters right now: AI adoption, changing study habits, and whether schools are preparing students for life beyond the classroom.
- Represent the full ecosystem. By surveying students, teachers, and parents, the report captures perception gaps across stakeholders. That multi-audience lens adds credibility and gives the media multiple angles to pull from.
- Compare YoY growth clearly.
- Make the data accessible. The landing page complements the PDF with clear highlights and key findings upfront, reducing friction and improving distribution potential. It’s built for skimming, sharing, and citing.
Standout Insights:
- 85% of teachers/students use AI (up from 66%)
- Teachers slightly outpace students in AI usage
- 36% say schools aren’t preparing students beyond classroom
Short reports can work, but depth builds authority. Similar to Duolingo, smaller brands may not have their scale, but proprietary data + simple visuals and explanations continue to win.
7. Turnitin
Crossroads: Navigating the intersection of AI in education
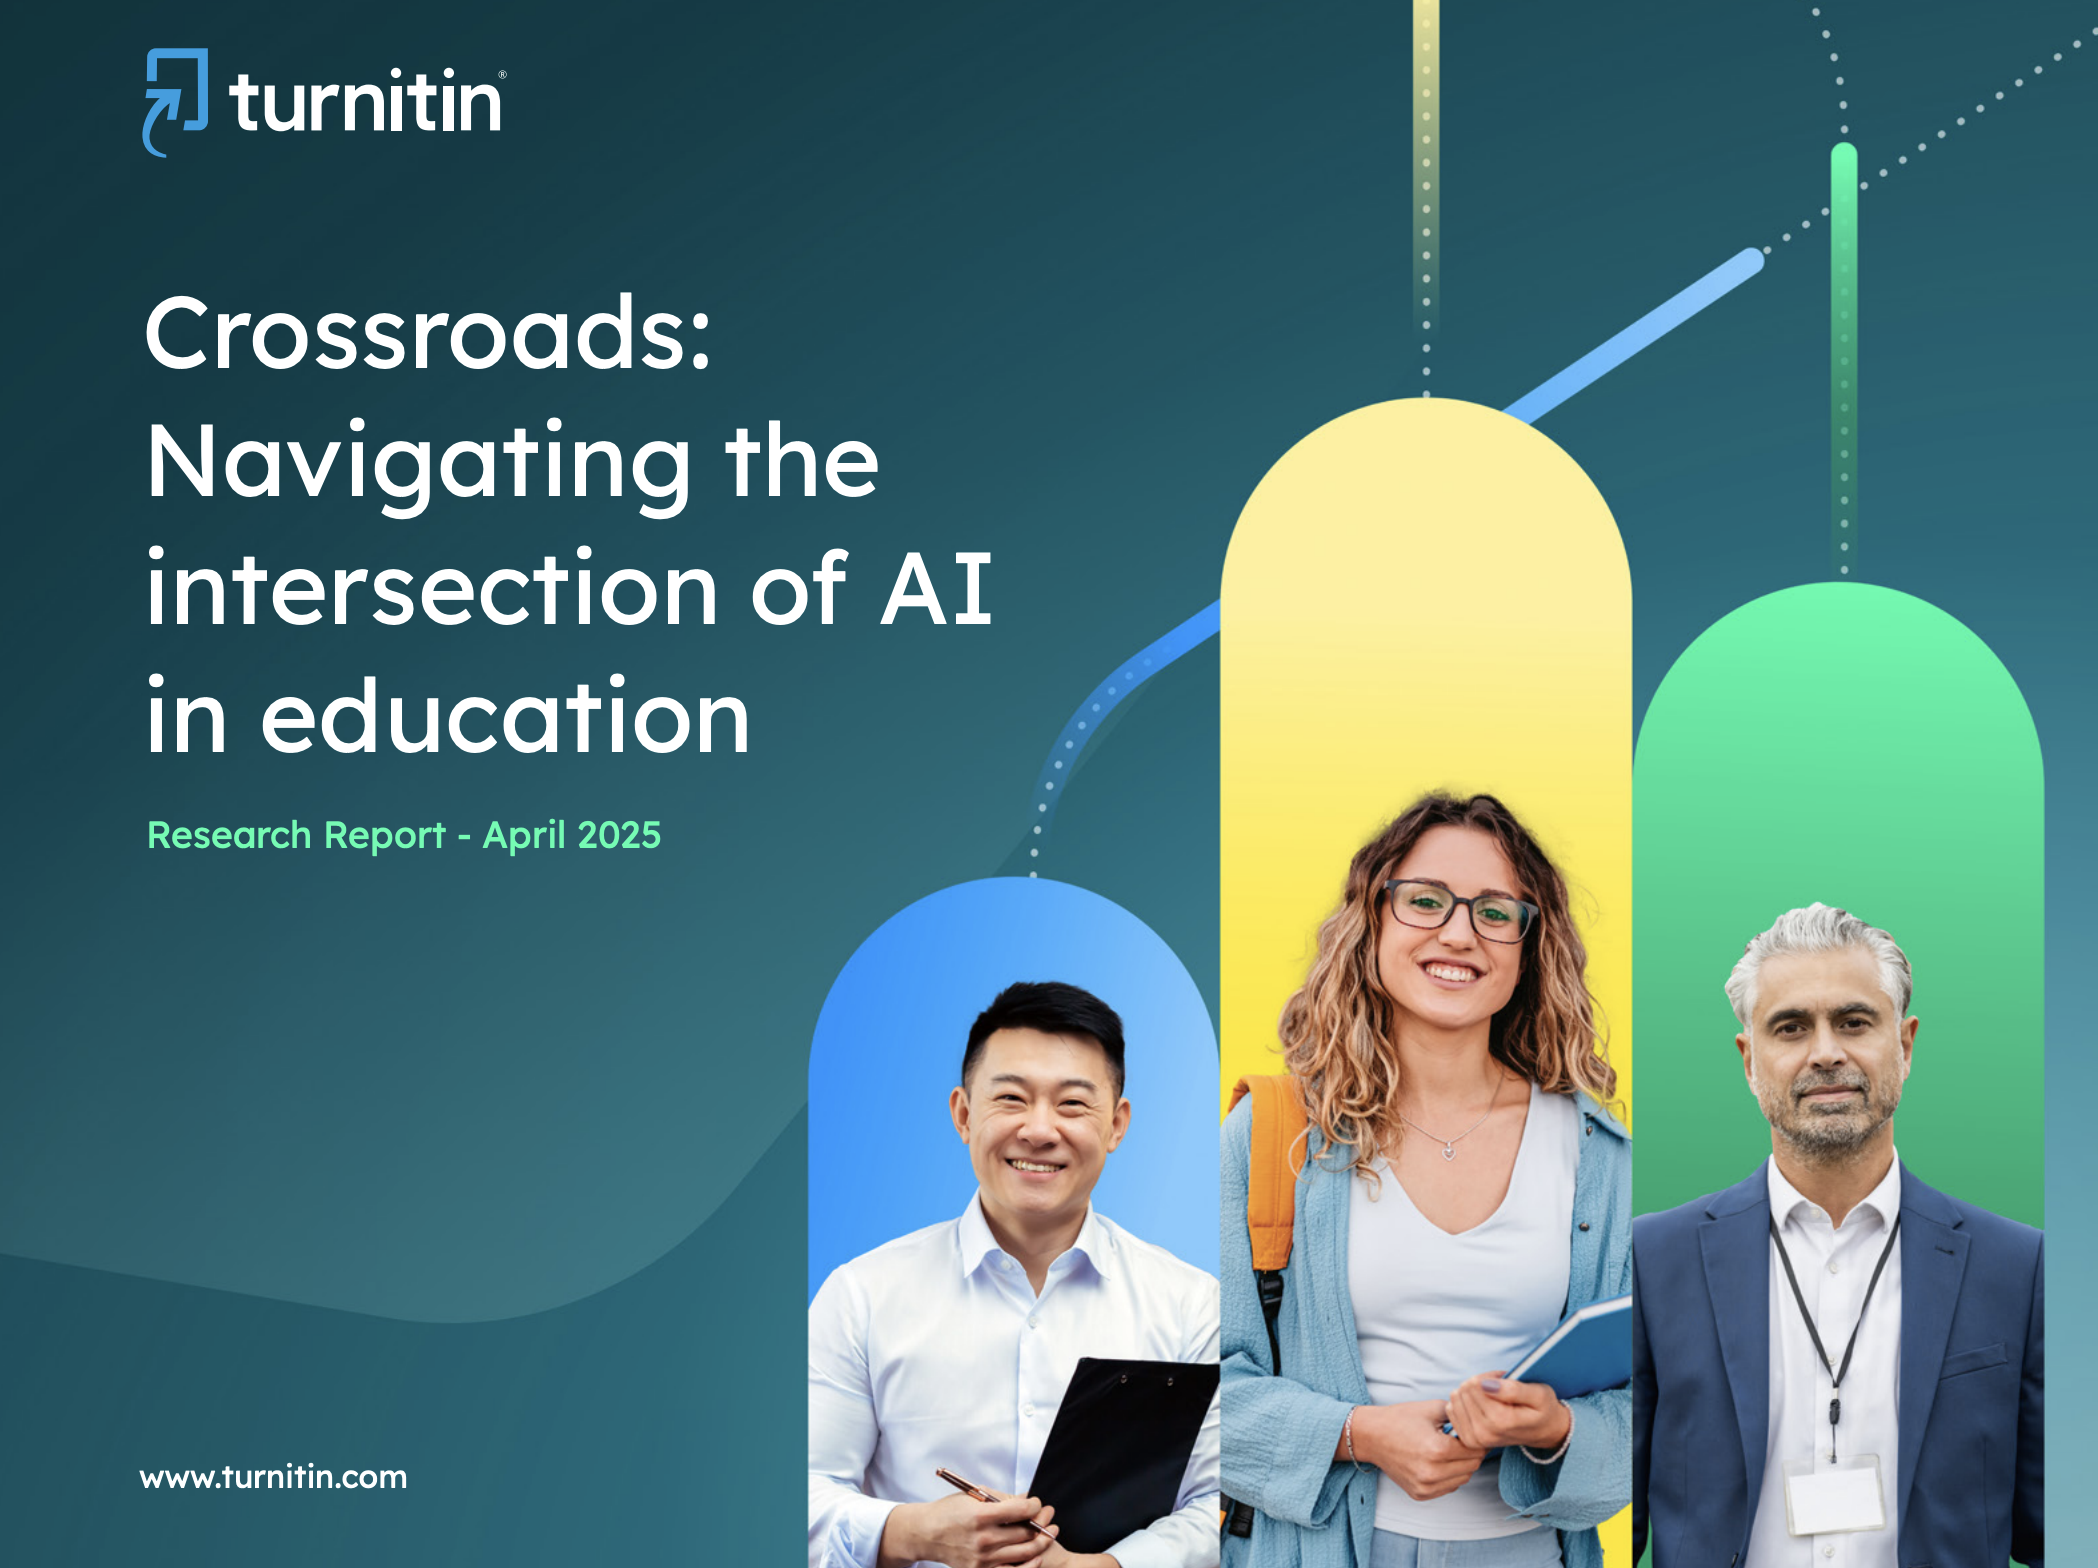
What the example is: A 24-page global whitepaper exploring how AI is reshaping academic integrity, assessment, policy, and workforce readiness.
Methodology: 3,500 respondents (students, educators, and academic administrators) across six countries.
What we loved: Turnitin doesn’t dance around the hard part. Instead of framing AI as purely transformative or purely dangerous, they position the education sector at a literal crossroads, caught between opportunity and misuse. That tension drives the entire narrative.
Here’s what they do best:
- Lean into the integrity conversation. While other reports focus on adoption growth, Turnitin centers on assessment, plagiarism, and ethical gray areas, which aligns perfectly with their brand authority.
- Use global comparisons to add depth
- End with forward-looking recommendations.The conclusion pushes institutions to evolve assessment models, improve educator training, and adopt AI responsibly—reinforcing that policy and pedagogy must adapt together.
Standout Insights:
- 78% feel positive about AI’s impact on education, yet 95% believe AI is being misused in some capacity at their institution.
- 55% of educators want to leverage AI but lack the knowledge to do so effectively.
- 50% of students want to use AI more strategically but feel unsupported.
That gap between willingness and preparedness is a sharp insight, and a clear opportunity narrative.
Turnitin’s strength is focus. They own the integrity conversation and frame AI as a systems-level shift, not just a tool adoption trend. By positioning educators as the linchpin between misuse and meaningful use, they elevate the discussion beyond fear and into governance, training, and redesign.
If we were advising them? We’d turn the “AI misuse” statistic into a headline index (e.g., an annual Integrity Confidence Score) to create even stronger repeatability and media pickup year over year.
8. Udemy Business
2026 Global Learning & Skills Trends Report
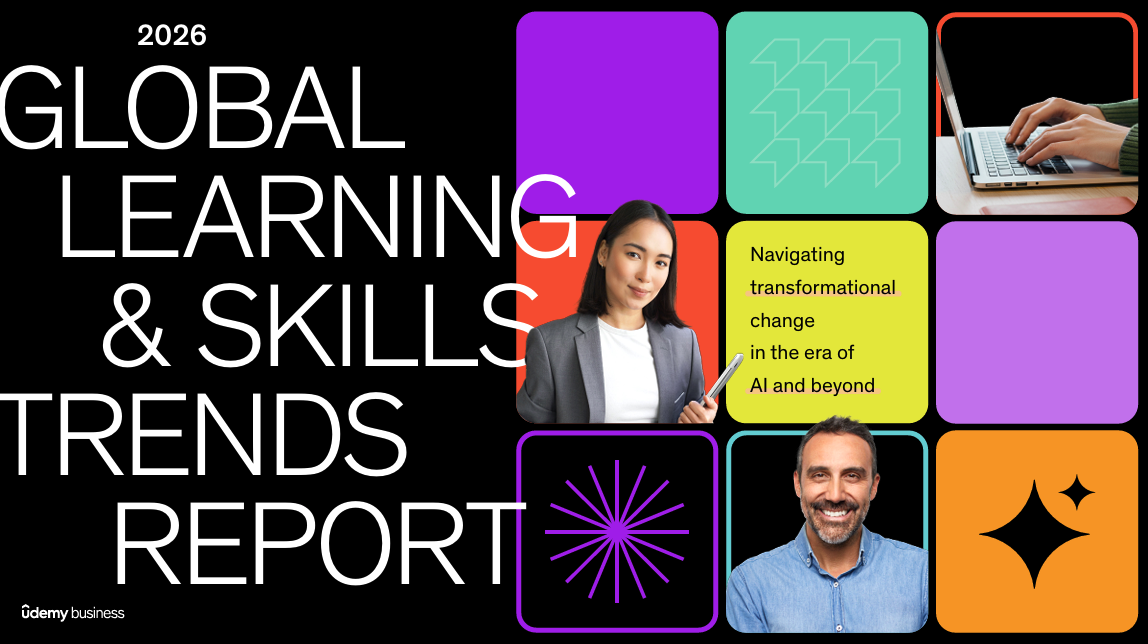
What the example is: Udemy Business’s 2026 Global Learning & Skills Trends Report analyzes enterprise learning consumption data from thousands of organizations worldwide. Rather than surveying intent, Udemy looks at actual course consumption behavior to identify which skills are accelerating, which are plateauing, and what that signals for the future of work.
Methodology: Consumption data July 2024–June 2025.
What we loved: This report reframes the AI conversation in a way most brands don’t. Instead of saying “AI is the future,” they argue something more nuanced: “If AI is your finish line, you’ve already lost the race.”
Here’s what they do best:
- Use consumption data as a signal of real demand. Instead of asking learners what they plan to learn, Udemy analyzes what they’re actually spending time on.
- Pair AI fluency with adaptive skills. They highlight foundational AI knowledge, applied in-role training, cross-functional learning agility, and leadership as architects of change, not just technical upskilling.
- Organize trends clearly and narratively. The report flows from macro AI acceleration into cultural and organizational implications, rather than presenting disconnected stats.
- Translate skills data into leadership strategy. This isn’t a training report, it’s an operating model conversation.
- Make bold, quotable statements. Strong framing makes the report more likely to be cited, shared, and discussed.
Standout Insights:
- 11M+ GenAI course enrollments to date on Udemy, with more than 10 new GenAI enrollments per minute.
- 1,400+ AI courses available on Udemy Business.
- ChatGPT remains the #1 most learned existing AI topic, while AI agents / agentic AI emerged as the fastest-growing new topic.
- Adaptive skills learning grew 25% year over year, placing it among the fastest-growing communication and business skill categories.
- Learners who apply skills in practice with feedback learn 3x more efficiently than those learning through lecture alone,reinforcing the “immersion beats instruction” thesis.
Udemy Business succeeds because it treats AI not as a skills trend, but as a catalyst for organizational redesign. Their data makes a clear case: AI fluency matters, but adaptability is the real differentiator in 2026 and beyond.
9. TalentLMS
The TalentLMS 2026 Annual L&D Benchmark Report
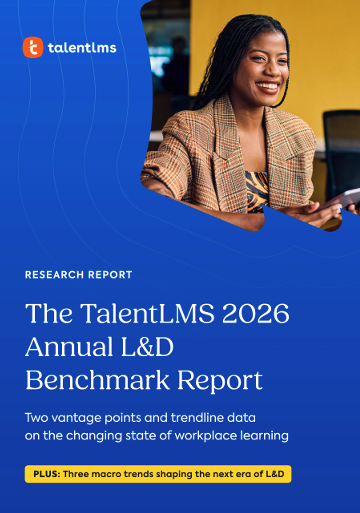
What the example is: The TalentLMS 2026 Annual L&D Benchmark Report is a data-driven look at how workplace learning is evolving under pressure from AI acceleration, heavy workloads, and shifting employee expectations.
Methodology: 1,101 respondents (HR managers + employees).
What we loved: We loved the inclusion of “Expert’s Take” commentary blocks, which ground the data in pract
ical L&D leadership perspective. That blend of numbers + interpretation strengthens credibility. Most importantly, the report ends with 10 data-backed interventions, which turns insight into operating guidance.
Here’s what they do best:
- Highlight perception gaps. HR managers often report confidence in their learning strategies, while employees describe time pressure, disengagement, and multitasking. That contrast is compelling and actionable.
- Connect learning to retention and growth. The report reinforces that training isn’t a “nice-to-have”, it’s tied to employee commitment and long-term workforce competitiveness.
- Address AI without oversimplifying it. Instead of framing AI training as purely technical, they explore how it impacts workload, automation fears, and performance expectations.
- Focus on practice over theory. Nearly a third of employees say training is too theoretical. The report strongly advocates for hands-on application.
- Provide concrete interventions. From protecting learning time to embedding development into KPIs, the recommendations feel operational, not abstract.
Standout Insights:
- 70% of employees multitask during training — the highest level in three years.
- The top three employee training challenges:
- Lack of time
- Not enough hands-on practice
- Difficulty staying motivated
- 53% of employees say heavy workloads leave little room for training.
- 64% of managers say upskilling/reskilling the current workforce is their primary approach to closing skills gaps.
- About half of organizations still view training time as time away from “real work.”
- Employees are more likely to stay with companies that invest in their development — reinforcing training as a retention lever.
The overarching insight: technology is racing ahead, but organizational capacity to learn isn’t scaling at the same speed.
10. LearnUpon
The State of Learning and Development in 2025
What the example is: This report examines how L&D teams are evolving from course creators to strategic business partners. The report centers on three themes: maturity, measurement, and momentum, exploring how advanced organizations connect learning to performance, ROI, and employee experience.
Methodology: survey of 600 L&D leaders and practitioners across the US, UK, and ANZ.
What we loved: We loved the regional comparisons, which add depth and media angles. For example, Australia leads in L&D maturity across several categories, while the U.S. lags in skills development strategy. Visually, the report takes a creative approach with painting-style imagery and a distinctive design identity. It feels different from the typical corporate whitepaper, which makes it memorable.
Here’s what they do best:
- Frame L&D as strategic maturity, not activity volume. The report shifts focus from “how many courses?” to “how aligned is learning with business impact?”
- Use regional benchmarking effectively.
- Highlight measurement confidence and tension. While 91% say they measure impact effectively, ROI remains a persistent challenge in multiple regions.
- Connect technology ecosystems to outcomes. The report emphasizes that tools alone don’t drive progress, integration does. When LMS, HRIS, collaboration tools, and LXP platforms work together, data becomes actionable insight.
- Position L&D as part of the employee experience. Learning is increasingly connected to performance, mobility, well-being, and long-term retention.
Standout Insights:
- Australia leads in maturity, with 38% rating onboarding as advanced, 40% in career development, and 48% in compliance training.
- Only 23% of U.S. respondents rate their skills development strategies as advanced, the lowest of any region studied.
- The U.K. performs strongly in performance-based learning, with 34% rating employee performance learning as advanced.
- 91% of respondents say they measure program impact effectively, but ROI is still cited as a top challenge (especially in ANZ and the U.S.).
- When measuring impact, companies most often prioritize skill development, knowledge retention, and completion rates (34%).
LearnUpon’s 2025 report reframes learning as a maturity journey. The future of L&D isn’t just about producing better courses, it’s about aligning systems, proving ROI, integrating technology, and embedding learning into the flow of work.
Conclusion
The best State of Education reports do these three things well:
- They use proprietary data.
- They tell a compelling story with clear visuals.
- They provide actionable guidance educators and leaders can actually use.
In a world flooded with AI summaries and recycled insights, original research still wins.
If you want help turning your proprietary data into a flagship report that drives authority, links, and demand, reach out to our team!
Frequently Asked Questions
- What makes a great State of Education or L&D report?
A great State of Education or L&D report does more than publish data. It frames a conversation.
The strongest reports combine proprietary research, transparent methodology, thoughtful segmentation, and clear recommendations. They move beyond surface-level trends and answer a bigger question: what does this mean for leaders right now?
The best examples in this space humanize the data through personas, stakeholder comparisons, regional breakdowns, and year-over-year shifts. They invest in design for clarity, not decoration. And they end with specific, operational guidance. In a landscape flooded with recycled insights, original research paired with sharp narrative is what earns trust.
- Why is proprietary data so important for education and L&D brands in 2026?
In 2026, authority is built on ownership. Anyone can summarize trends. Few brands can generate them.
Proprietary data gives organizations something defensible to stand behind. When methodology is clearly defined, sample sizes are transparent, and findings are contextualized, the report becomes a reference point for media, educators, and enterprise leaders.
Original research is also one of the most durable SEO and digital PR assets a brand can create. It attracts citations, backlinks, and repeat coverage year after year.
- What are the top education trends to watch in 2026?
Across the strongest 2025 and 2026 reports, several themes continue to surface.
AI adoption is accelerating quickly in both K-12 and enterprise settings. At the same time, concerns around misuse, academic integrity, and skill erosion remain high. There is a widening training gap between leaders who believe support exists and educators or employees who say they have not received it.
Engagement is still difficult to define and even harder to measure consistently. Adaptive skills such as communication, collaboration, and learning agility are gaining ground alongside technical AI fluency. And practice-based learning continues to outperform lecture-heavy instruction.
The throughline is clear. AI is reshaping learning, but human capability is still the differentiator.
- How is AI changing education and workplace learning in 2026?
AI is no longer experimental. It’s embedded.
Students, teachers, and employees are using AI tools more frequently and more confidently. Enterprise learning platforms are seeing surging enrollment in generative AI content. Leaders are beginning to hire for AI-specific roles.
But the shift is not just about usage. Institutions are rethinking assessment models, governance policies, and professional development frameworks. The conversation has moved from whether AI belongs in education to how it should be implemented responsibly and strategically.
The real challenge in 2026 is alignment.
- What education technology trends are expected to dominate in 2026?
Generative AI tools and AI agents are at the center of the conversation, but they are not the only story.
Adaptive learning systems, micro-credentials, skills benchmarking tools, and AI-integrated assessment models are all gaining traction. Learning data is increasingly being used to inform workforce planning and performance strategy.
What stands out this year is that technology adoption is being tied directly to business outcomes and long-term readiness. EdTech is no longer framed as innovation for its own sake. It is being measured against impact.
- Why does engagement remain such a persistent challenge in education?
Everyone agrees engagement predicts achievement. Fewer agree on what engagement actually looks like.
Teachers, students, parents, and administrators often report different perceptions of focus, motivation, and classroom participation. Reports continue to show high levels of distraction and weekly boredom among students.
In 2026, engagement is increasingly understood as cognitive, behavioral, and emotional. Technology alone cannot solve for it. The strongest research points toward immersive, practice-based learning as the most reliable lever for deeper engagement and retention.
- How are L&D teams evolving in 2026?
L&D teams are being asked to prove impact, not just produce content.
The shift is from activity to maturity. Instead of counting courses or completion rates alone, advanced organizations are connecting learning to performance metrics, retention, mobility, and long-term workforce competitiveness.
There is also growing recognition that training cannot feel like time away from real work. High-performing teams are embedding learning into workflows, protecting dedicated learning time, and aligning development with business strategy.
In 2026, L&D is a strategic function, not a support function.
- Why do benchmarks, rankings, and indexes perform so well in education reports?
Benchmarks make data usable.
When a report introduces an index, a maturity model, or a country ranking, it creates a simple way for readers to contextualize themselves. It gives media outlets a headline. It gives leaders a reference point. It creates a structure that can be updated annually.
From a visibility standpoint, structured benchmarks are easier to cite, localize, and compare. That repeatability is what turns a report into a long-term authority asset.
- How long should a State of Education or L&D report be?
There is no ideal page count. There is only depth and clarity.
Many of the strongest reports fall between 20 and 50 pages, but length alone does not determine authority. Shorter reports can work when they are tightly focused and grounded in strong data. Longer reports succeed when they layer segmentation, regional analysis, and clear recommendations.
What matters most is that the research is defensible, the narrative is coherent, and the reader walks away with a clearer sense of what to do next.
Appendix
| Company | Sample / Data Source | Geographic Scope | Core Theme | Standout Element | Notable Verified Insight |
| Carnegie Learning | 656 K–12 educators (49 states + PR) | U.S. | AI Adoption in Schools | Six AI Personas (usage + optimism segmentation) | 40% “Cautious Observers”; AI-related cheating rose from 53% to 61% YoY |
| Discovery Education | 1,398 stakeholders + interviews | U.S. | Student Engagement | “What You Can Do” action sections | 90%+ say engagement predicts achievement; 8/10 students report weekly boredom |
| Microsoft | 1,851 respondents (weighted global study) | U.S., UK, AUS, Brazil, Japan, Saudi Arabia | AI Adoption + Workforce Readiness | Clear 4-chapter structure + published survey detail | Student “often use” AI jumped 26 pts; 70% of job skills expected to change by 2030 |
| Coursera | 170M+ learner data (109 countries) | Global | Skills Proficiency + AI Maturity | Global Skills Ranking Table + AI Maturity Index | 195% GenAI enrollment growth YoY; US ranks #27 globally |
| Duolingo | Platform learning behavior data (Oct 2024–Sept 2025) | Global | Global Language Trends | Country-by-country rankings + cultural framing | English studied in 154 countries; Japanese rose to #4 globally |
| Quizlet | 2,003 students, teachers, parents (survey) | U.S. | AI + Learning Habits | Concise, AI-forward snapshot | 85% of teachers/students use AI (up from 66% in 2024) |
| Turnitin | 3,500 respondents | 6 countries | AI + Academic Integrity | Clear tension framing (optimism vs misuse) | 95% believe AI is misused in some capacity |
| Udemy Business | Learning consumption data (July 2024–June 2025) | Global enterprise users | AI Fluency + Adaptive Skills | “Adaptive skills” framework | 11M+ GenAI enrollments; adaptive skills up 25% YoY |
| TalentLMS | 101 HR managers + 1,000 employees | U.S. | L&D Friction + Retention | 10 Data-Backed Interventions | 70% multitask during training; 73% would stay longer with training |
| LearnUpon | 600 L&D leaders (Censuswide) | U.S., UK, ANZ | L&D Maturity + ROI | Regional maturity comparisons | 91% say they measure impact effectively; Australia leads in maturity |


Leave a Reply